

What a UX law is
A UX law is an observation about how people behave that has held up well enough to design with. It's not a law of physics. Several on this list are better described as heuristics (rules of thumb) or effects, and each has limits you should know before you lean on it. Some are older than the web: Max Wertheimer described how people group dots in 1923, and Paul Fitts measured how fast people move to a target in 1954.
The practical value is that a law gives a design decision a reason other than taste. If someone says “I prefer the button on the left,” the room argues about taste. If someone says “people look for the logo there, and one study counted how often they failed when it moved,” the team has something to check. Here are ten worth knowing, each with one real case you can look up.
1. Jakob's Law
Jakob's Law says users spend most of their time on other sites, so they prefer yours to work the way the others do. Jakob Nielsen formulated it in 2000, in an article from July that year (opens in a new tab). People arrive with those habits whatever you intended.
A 2016 Nielsen Norman Group article (opens in a new tab) reports a study in which 50 people each used one of 14 fashion-retail sites. Eight of the sites centered their logo and six kept it left-aligned. Each person picked a gift under $100, added it to the cart, then was asked to go to the site's starting page. People were 6 times as likely to fail to get there in a single click when the logo was centered. Jakob Nielsen has described a study with that six-fold gap as 4% failing with a left-aligned logo against 24% with a centered one.
See it in real products
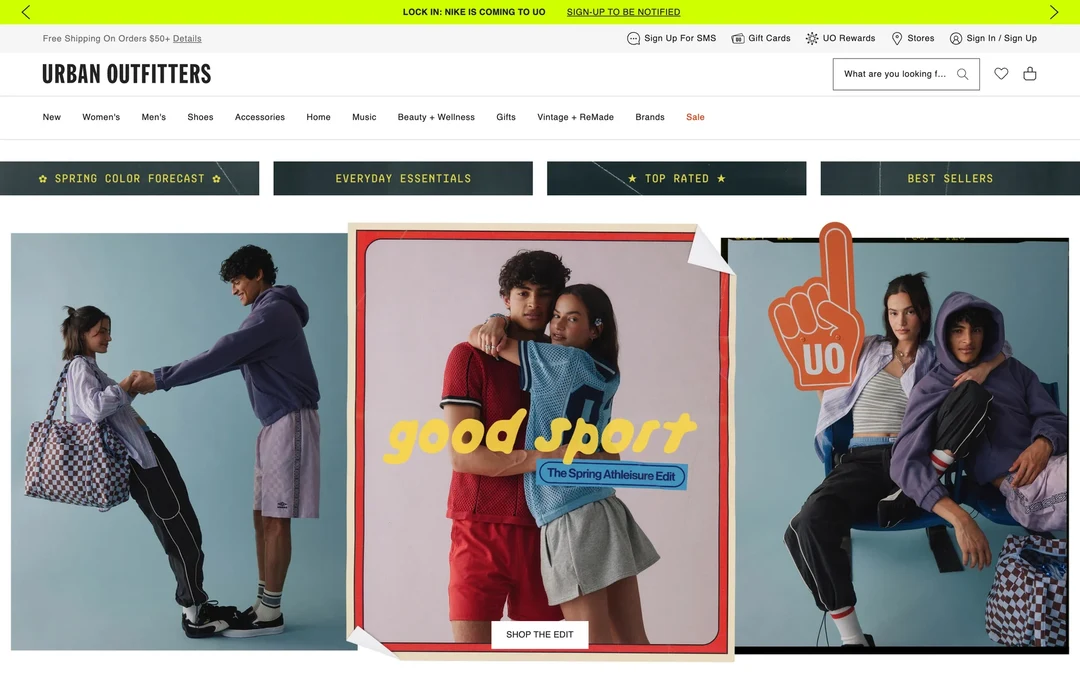
Logo left, search and bag right
- 1
Note 1: The “URBAN OUTFITTERS” logo sits in the top-left corner. Most shops put their logo there, so it’s the first place you’d look for it.
- 2
Note 2: The search box, the heart and the bag icon are at the top right. You’ll find the same three things in that corner on most other shops.
- 3
Note 3: The main sections, from “New” to “Sale”, run in one row under the logo, where you’d expect a shop’s menu to be.
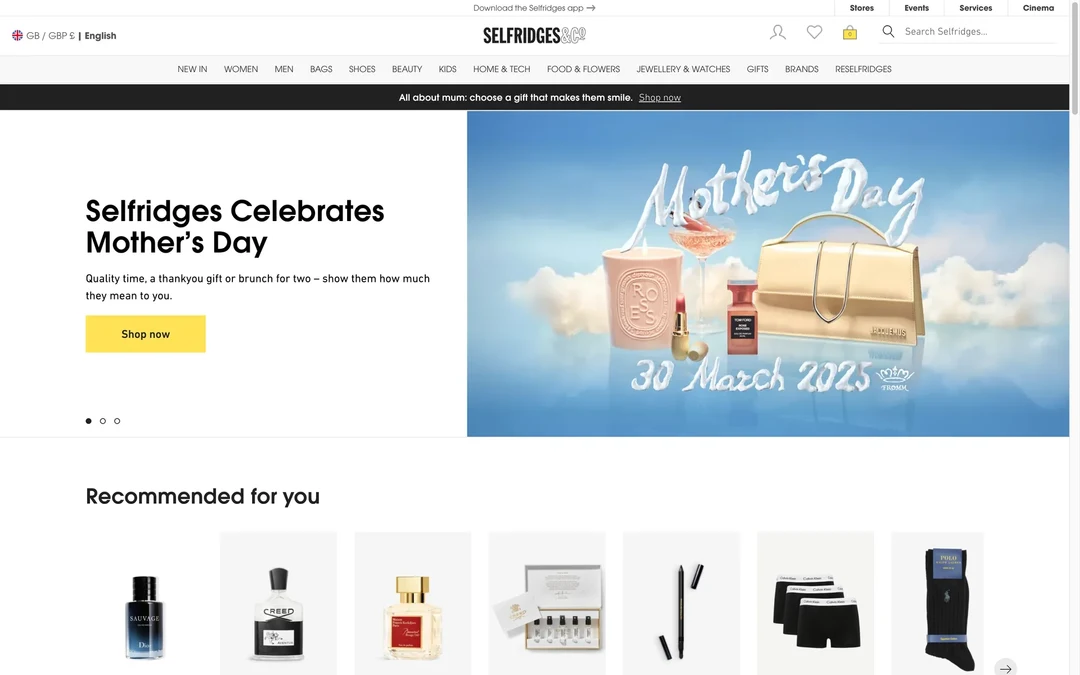
The logo moves to the middle
- 1
Note 1: The Selfridges logo is centered in the top bar. In the 2016 study, people more often failed to reach the homepage in one click on sites with a centered logo.
- 2
Note 2: The search box is still at the top right, where you’d expect it. So the page keeps that habit and changes only where the logo goes.
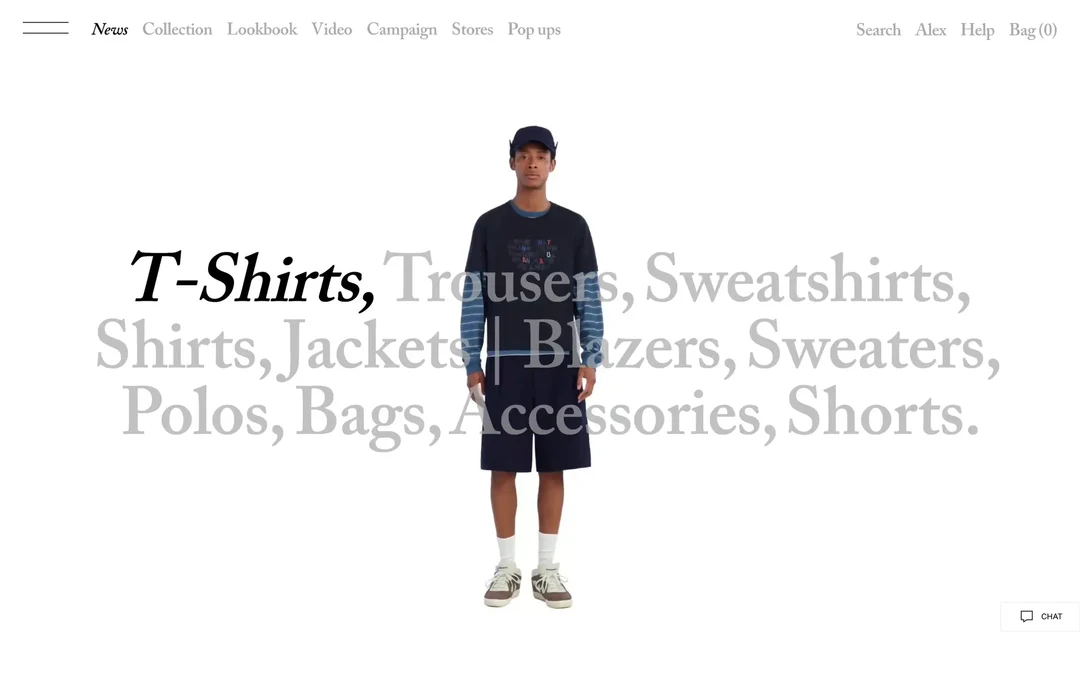
No logo in the usual corner
- 1
Note 1: There’s no logo in the header here. The top-left corner, where you’d look for one, holds a menu icon instead. (Open the menu and the Zara logo appears.)
- 2
Note 2: Search is the grey word “Search”, with no box and no magnifying glass. It’s in the usual corner, but it doesn’t look like the search you know from other sites.
2. Fitts's Law
Fitts's Law says the time it takes to reach a target depends on how far away it is and how big it is. The farther and smaller the target, the longer the movement takes. Psychologist Paul Fitts published the finding in 1954. He had people move a stylus back and forth between two plates and tap each one at its center, with plates of different widths and distances apart.
Push the pointer to the top edge of a Mac screen and it stops there, so you can't overshoot a menu item that sits against the edge. Nielsen Norman Group uses this to explain Fitts's Law (opens in a new tab): macOS puts the application menu at the very top of the screen, which turns each menu item into what the article calls an infinite target.
The edge trick has a limit. It works with a mouse or trackball, where the screen edge stops the pointer. A study by Daniel Avrahami, described in the same article, found that on touchscreens it actually takes longer to hit targets placed around the edges.
See it in real products
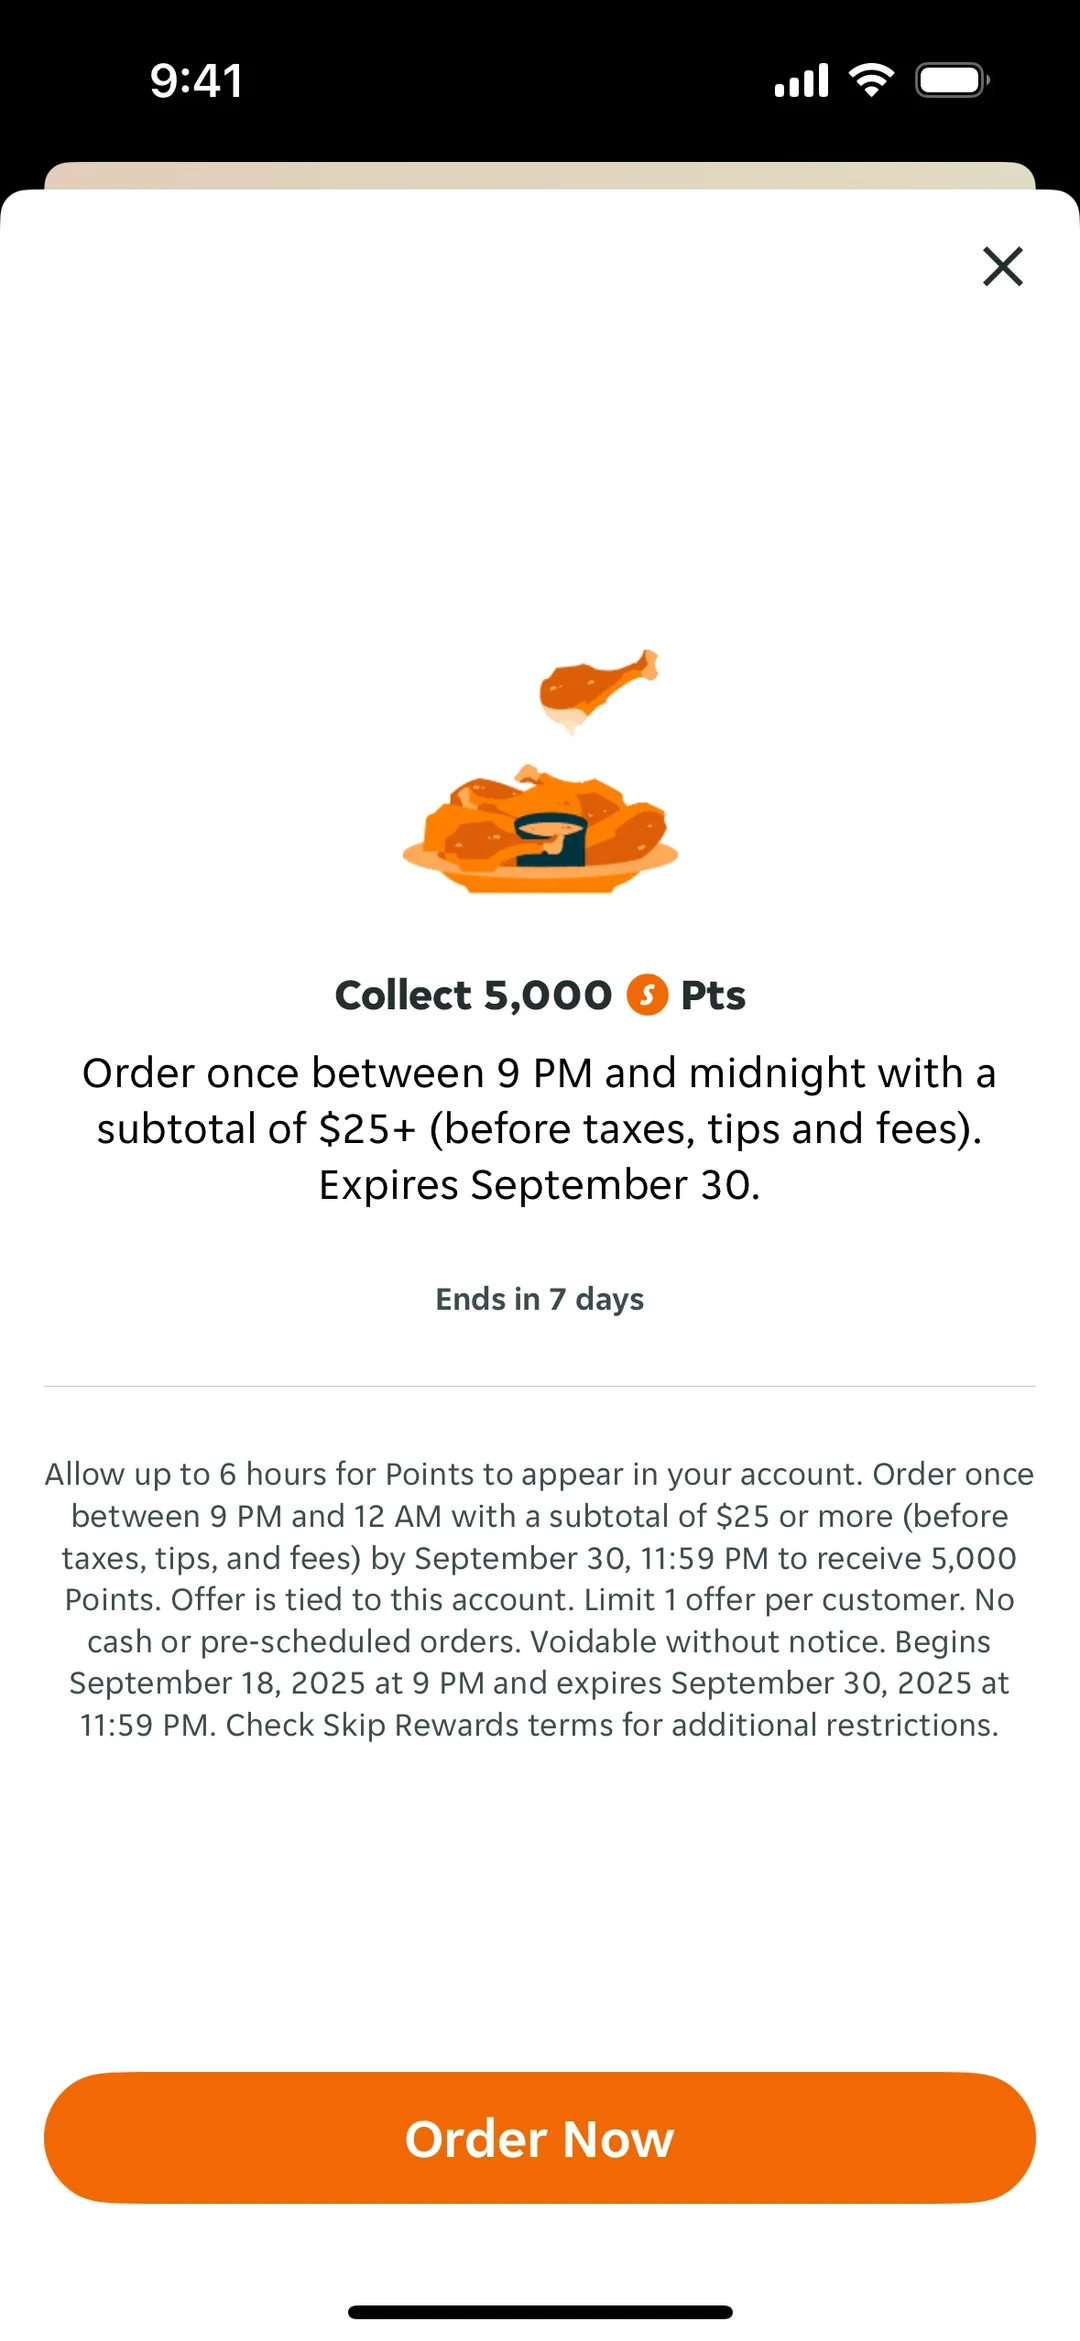
A big button near, a small X far
- 1
Note 1: “Order Now” stretches across the whole width at the bottom of the screen. It’s a big target that sits close to where your thumb rests.
- 2
Note 2: The X that closes the offer is small and sits in the top corner, far from the button. A small target that far away takes longer to hit.
Compose is big, the rest is small
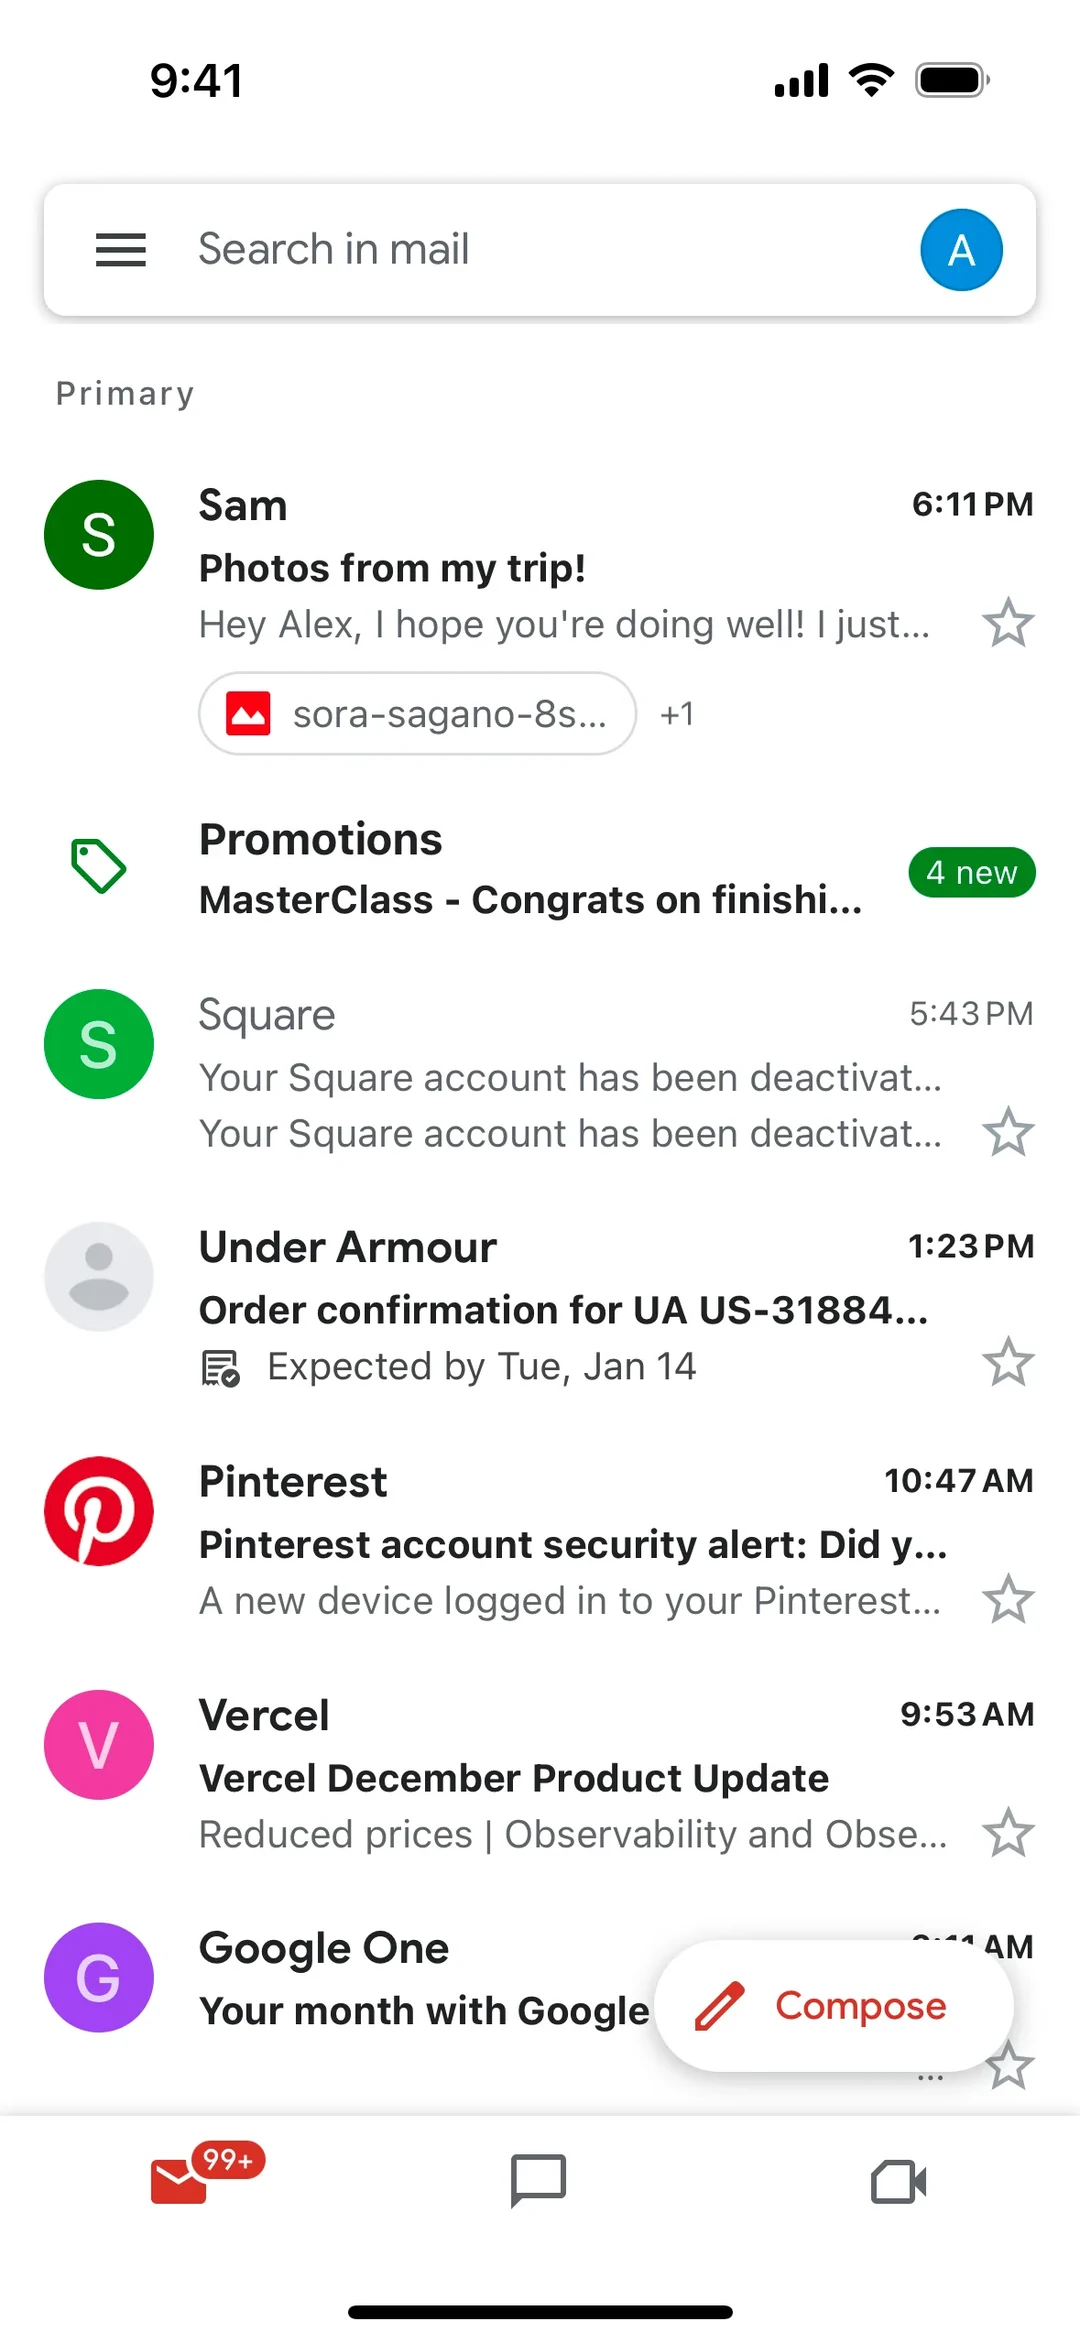
- 1
Note 1: “Compose” is a wide pill with a word and an icon, floating at the bottom right. Writing a message is what most people do here, and the button sits where your thumb rests.
- 2
Note 2: Each email has a small outline star at the right edge. You star a message now and then, so its target is small.
- 3
Note 3: The menu icon is in the top-left corner, the farthest spot from a right thumb. You open it to switch folders, which you do far less often than you write.
Both choices get a full-size button
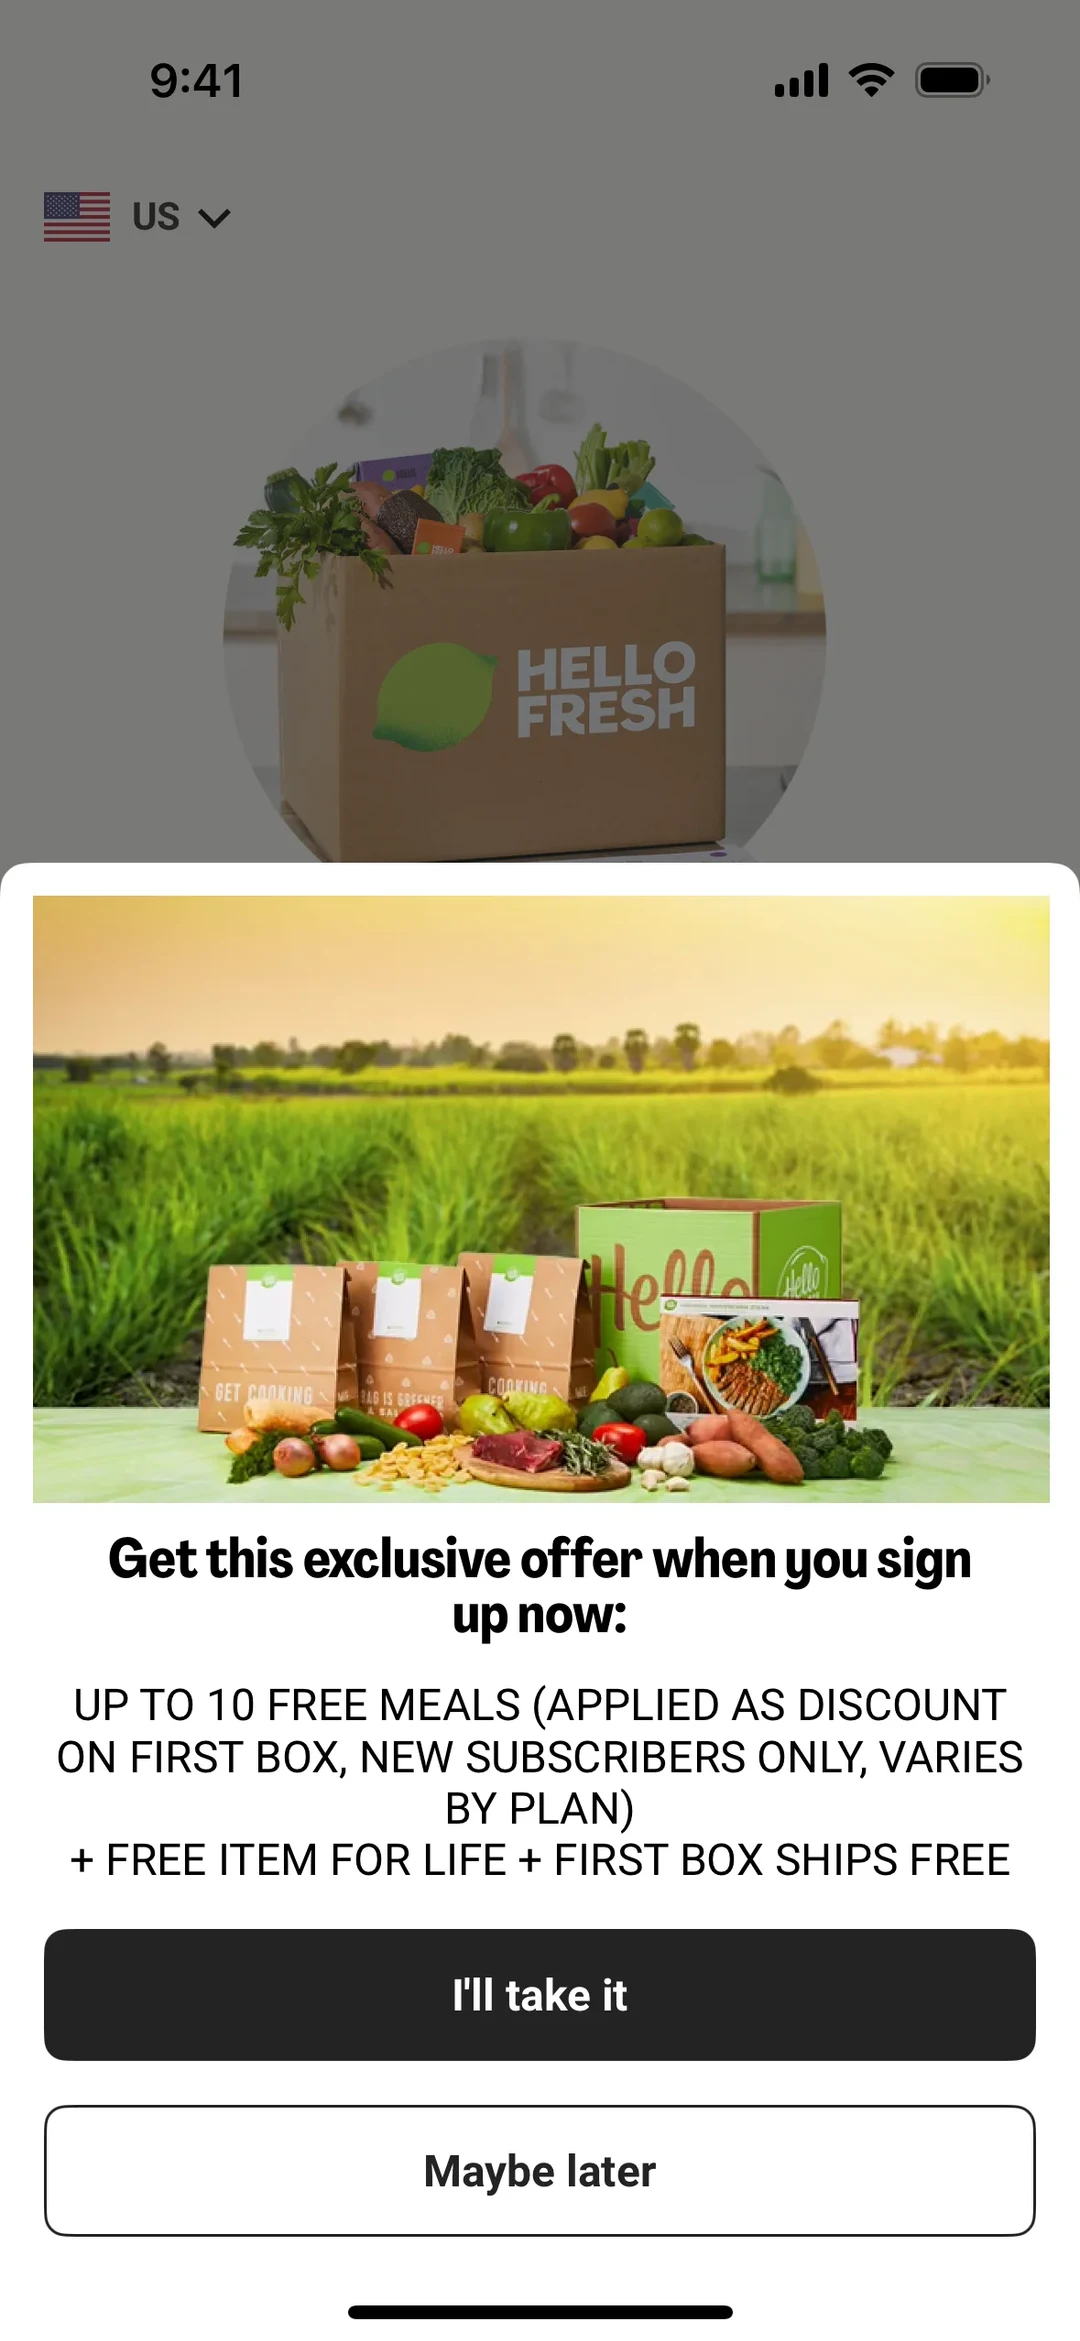
- 1
Note 1: “I’ll take it” is a full-width button near the bottom of the sheet.
- 2
Note 2: “Maybe later” has the same width and height, right under it. Whichever you pick, you get an equally big target close to your thumb.
3. Hick's Law
Hick's Law says the time it takes to make a choice rises with the number of options, but slowly. Each doubling of the options adds about the same extra delay, because people sort options into groups (opens in a new tab) and drop about half of what remains at each step.
William Edmund Hick began his experiments in 1951 and published them in 1952. He arranged ten lamps in a circle around each volunteer and paired each lamp with a Morse key worked by a different finger. A random lamp lit every 5 seconds, and the volunteer pressed the matching key. Hick found that reaction time rose with the logarithm of the number of possible choices, which is that doubling pattern.
Ray Hyman extended the work in 1953, so you'll also see the Hick-Hyman law. The law is often quoted as “fewer options is always better.” It doesn't say that. It describes reaction time for equally likely choices. Studies of spoken answers to familiar items found little or no extra time as options grew. In a randomly ordered list, people read item after item, so time rises in a straight line and Hick's Law doesn't apply. In an alphabetical list, someone who knows the name can split the list and search in logarithmic time.
See it in real products
Labels let you skip whole groups
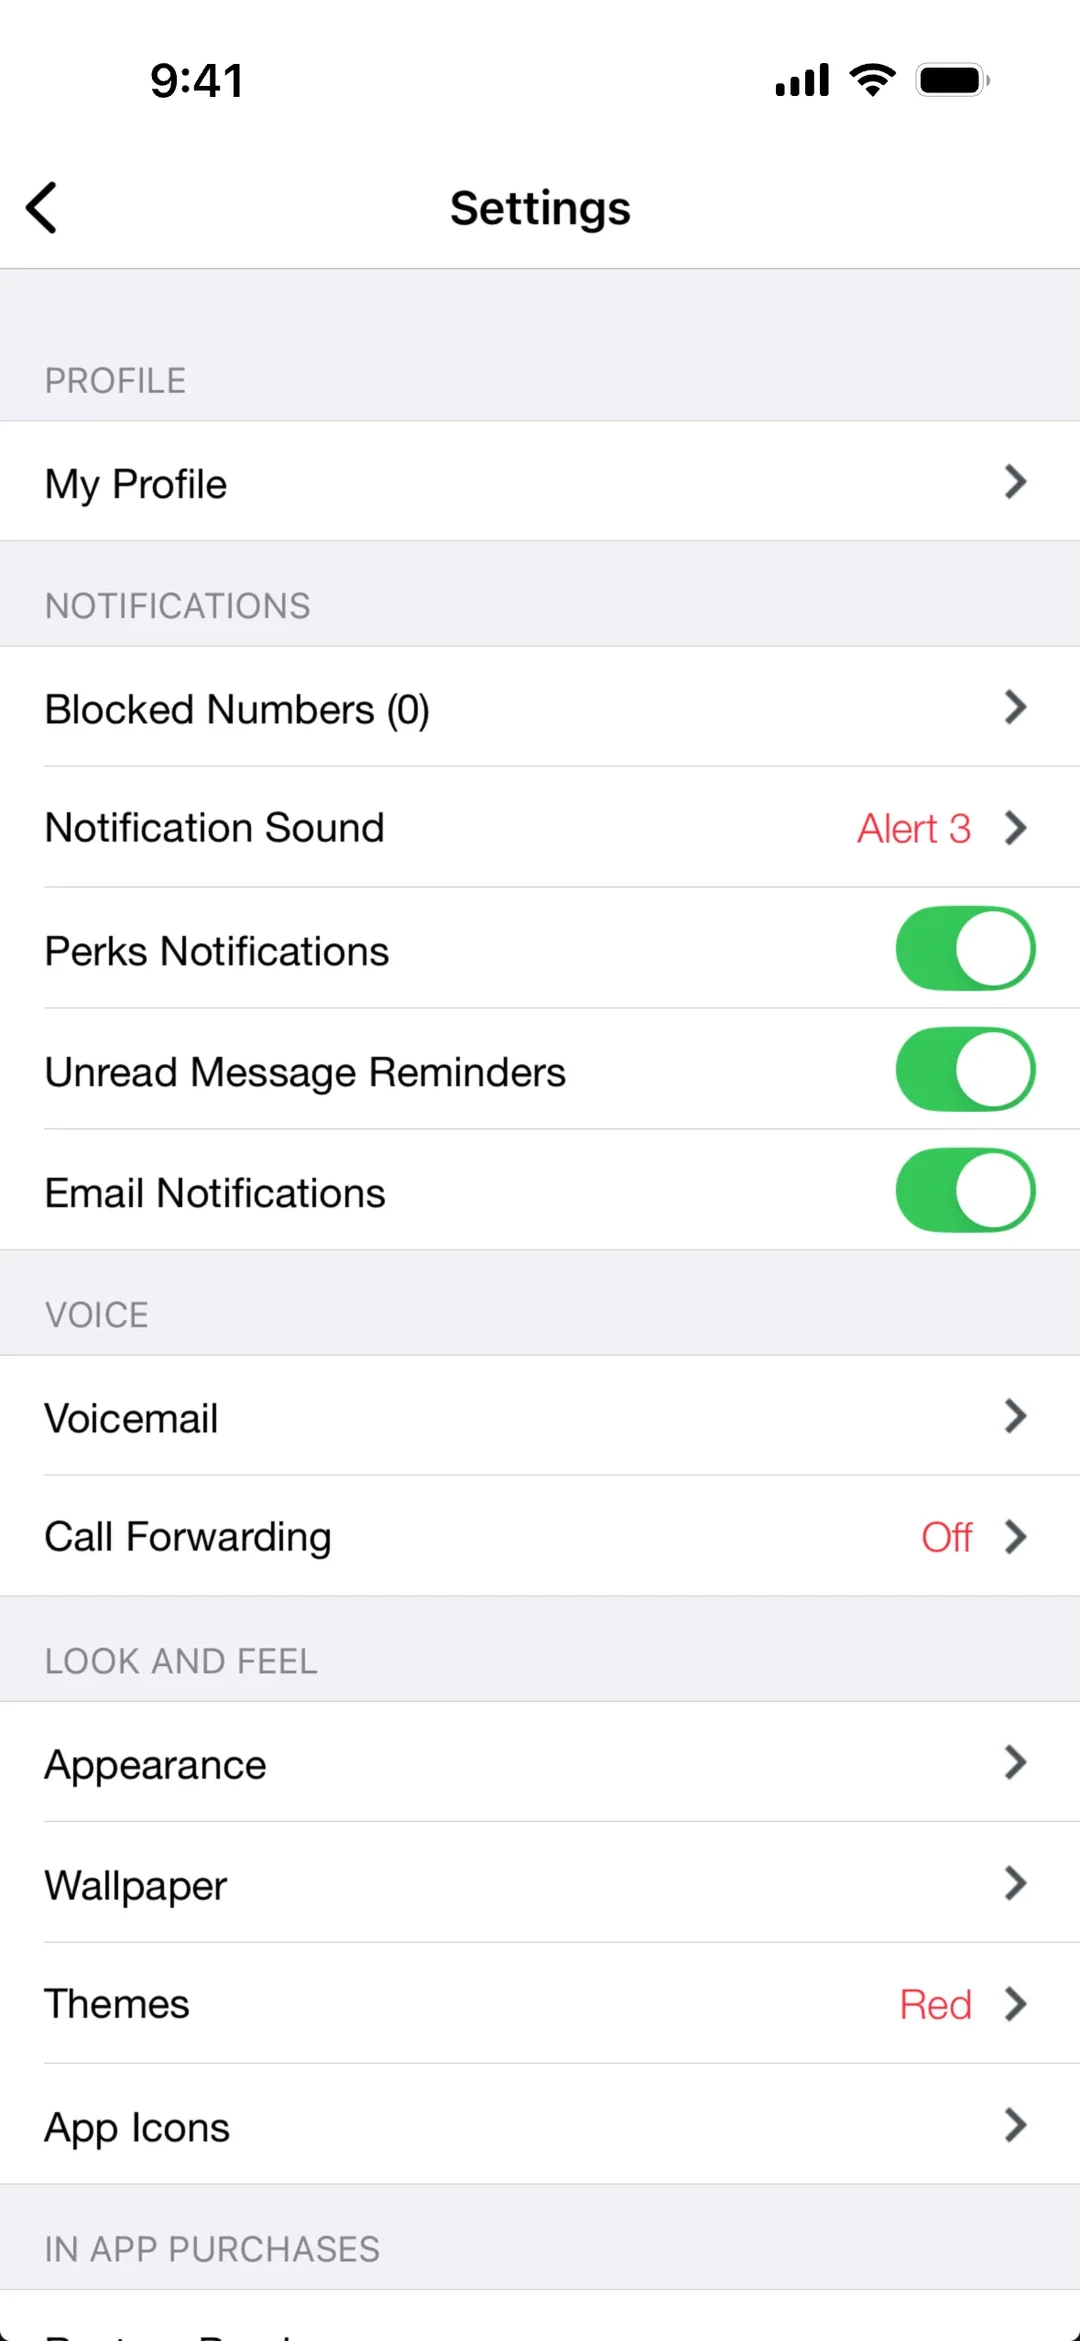
- 1
Note 1: Every setting sits under a grey label such as “NOTIFICATIONS” or “VOICE”. You read the few labels first, then only the rows under the one you need.
- 2
Note 2: Want a new wallpaper? “LOOK AND FEEL” holds “Appearance”, “Wallpaper”, “Themes” and “App Icons”, so you can skip every row above it.
Strict A to Z order
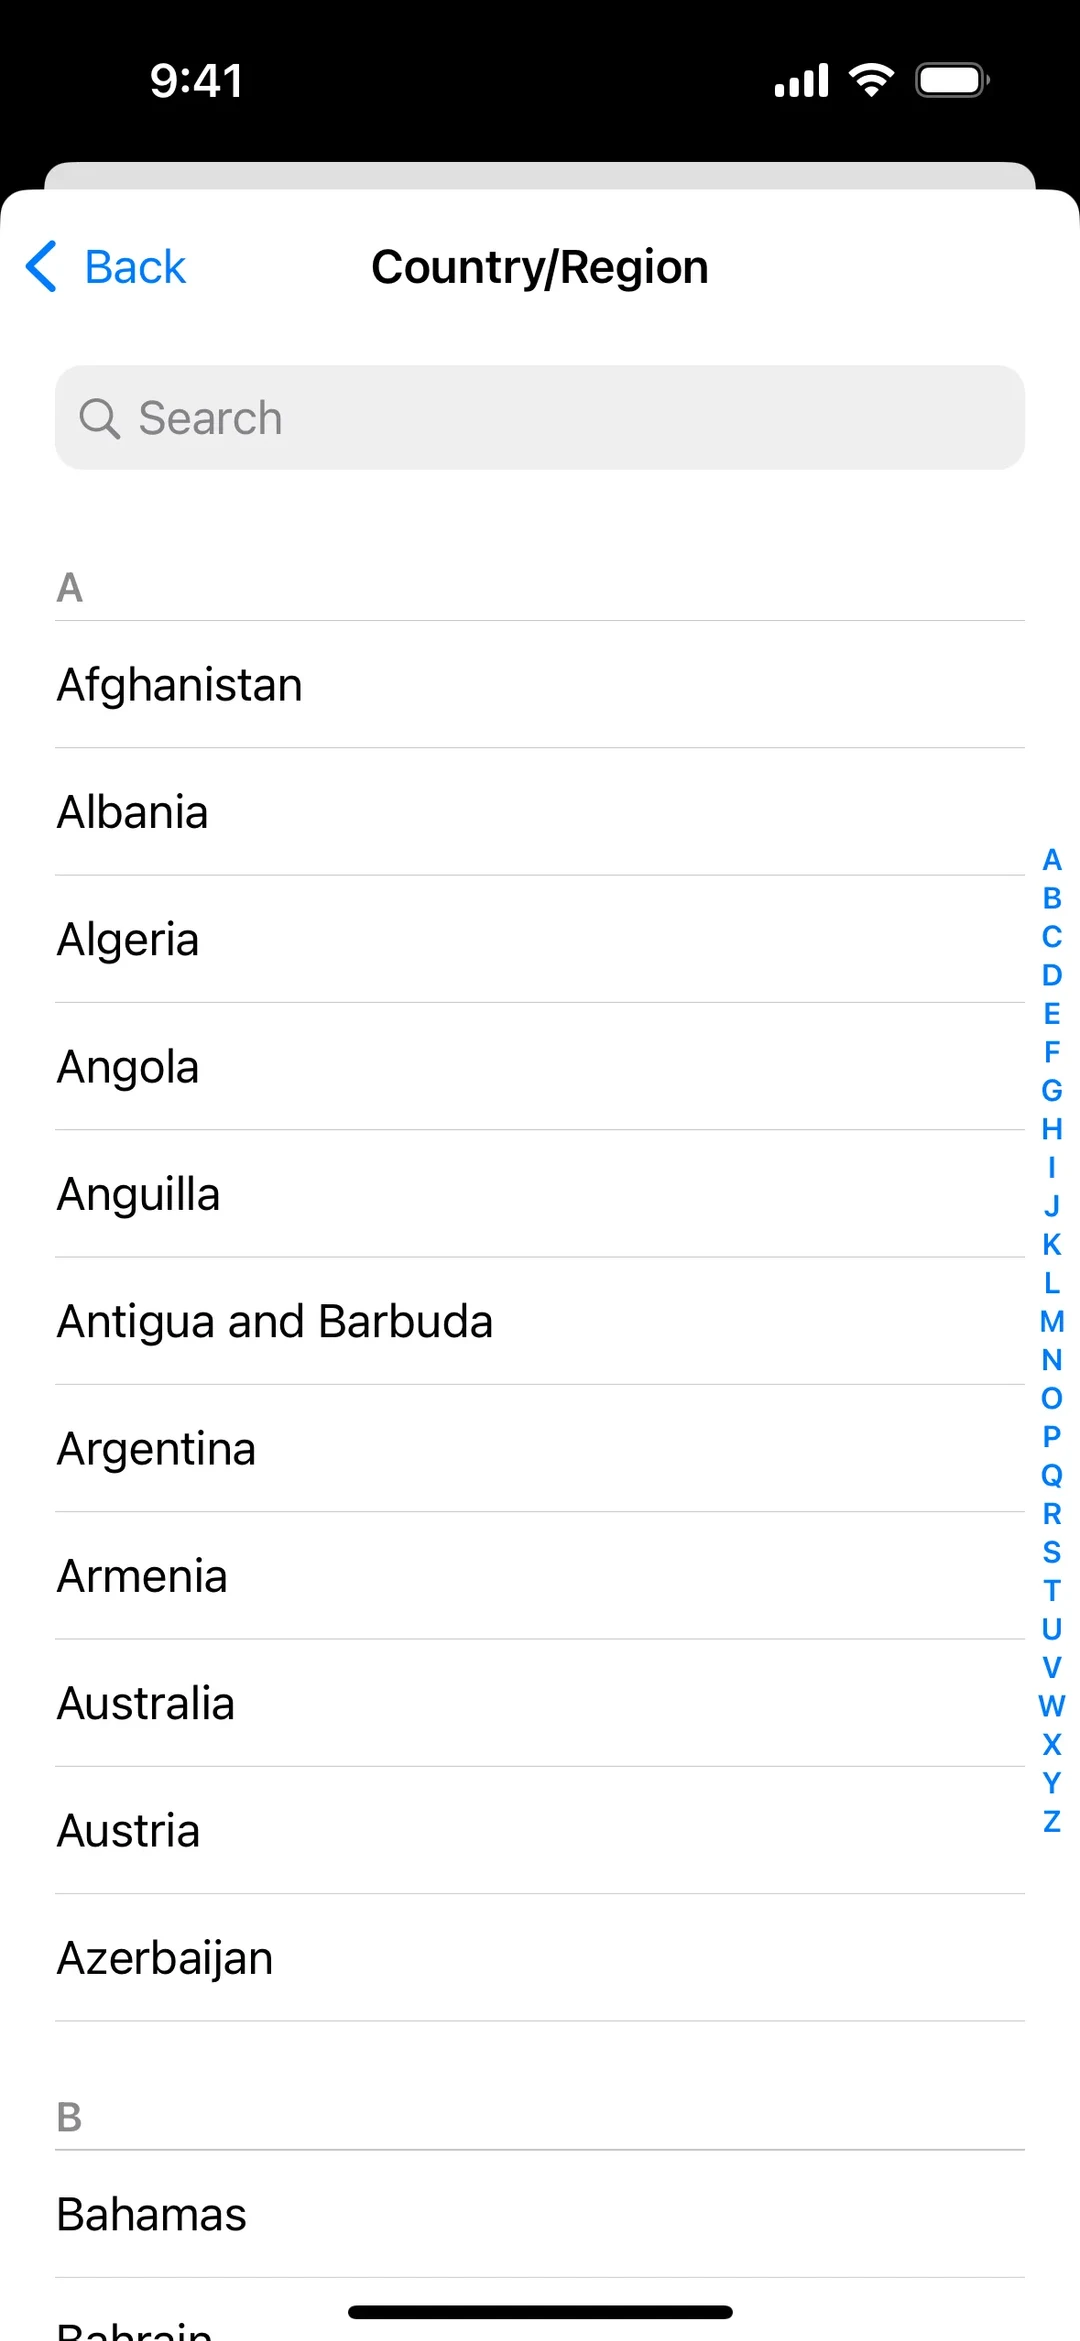
- 1
Note 1: Under “A”, the countries run from “Afghanistan” to “Azerbaijan” in strict alphabetical order. If you know the name, you know where it must be.
- 2
Note 2: The blue letters down the right edge let you jump to any letter at once. You rule out most of the list before you read a single name.
Letters in order, names not
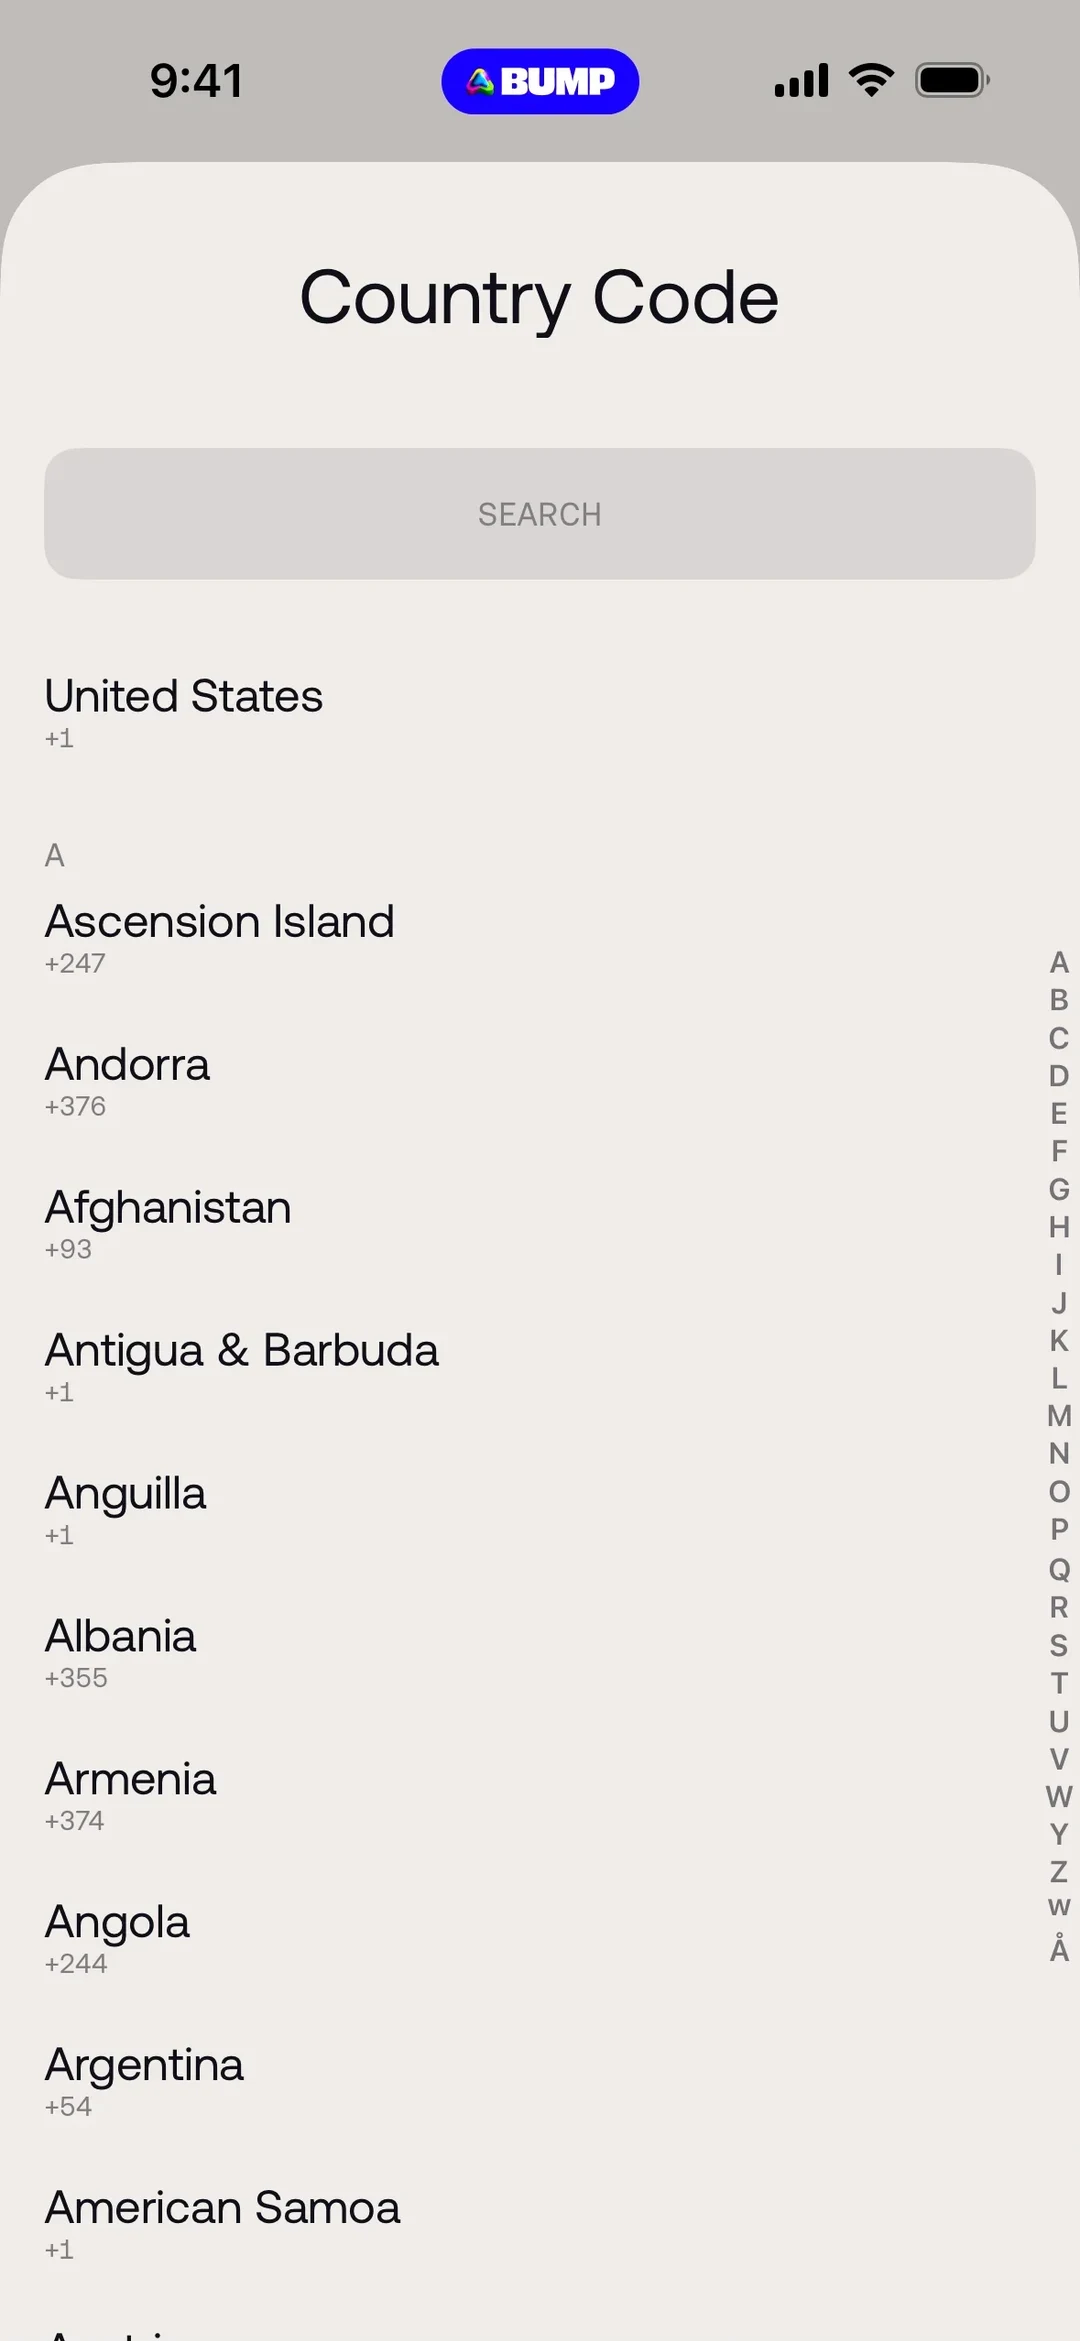
- 1
Note 1: Under “A”, “Andorra” comes before “Afghanistan”, and “Albania” comes after “Anguilla”. Knowing the name doesn’t help here, so you read the A rows one by one.
- 2
Note 2: “United States” sits alone above the A section. If that’s your country, you can pick it without reading the list at all.
4. Miller's Law
Miller's Law says short-term memory holds a limited number of chunks, the units you've learned to treat as one. George Miller made the case in his 1956 paper The Magical Number Seven, Plus or Minus Two (opens in a new tab).
The paper describes a test the psychologist Sidney Smith reported in 1954. Among 20 volunteers, memory span was 9 for binary digits (zeros and ones) and 7 for octal digits (the numbers 0 to 7). Smith taught them to rename each group of three binary digits as one octal digit, so 18 binary digits became 6. Smith then drilled himself on it and could repeat back 12 octal digits, the same as 36 binary digits. With bigger groups he reached about 40.
The seven in the title has since been revised. In 2001 Nelson Cowan reviewed the evidence (opens in a new tab) and wrote that Miller meant it as a rough estimate and a rhetorical device, not a real limit. Cowan put capacity at three to five chunks, averaging about four. People also stretch it to cap menus at seven items. Miller tested what people could recall, not how long a visible menu can be.
See it in real products
Six boxes, split three and three
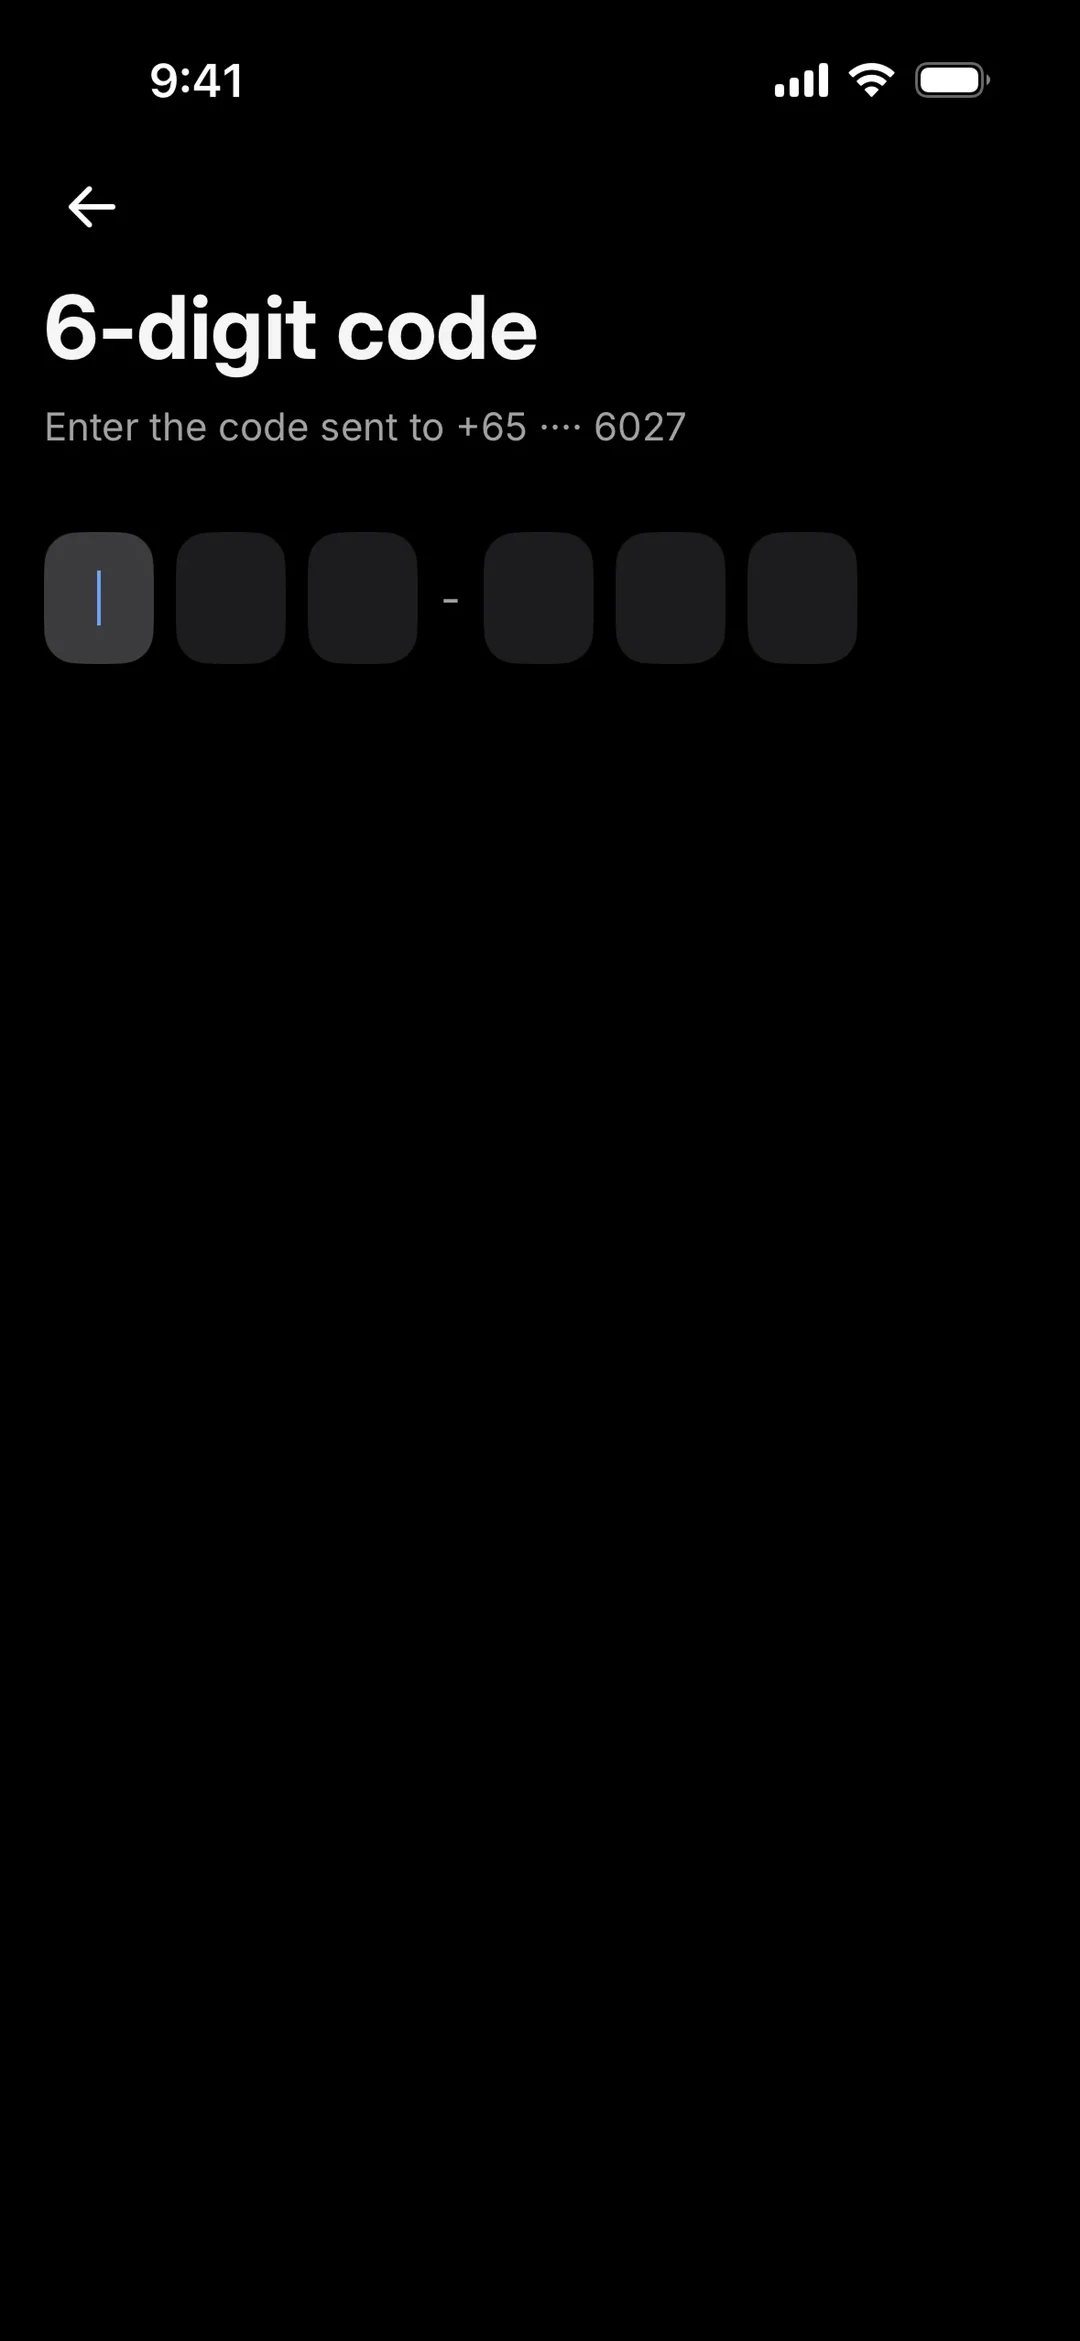
- 1
Note 1: A short dash splits the six boxes into two sets of three. You can carry the code over from your messages as two small groups instead of six loose digits.
A card number in groups of four
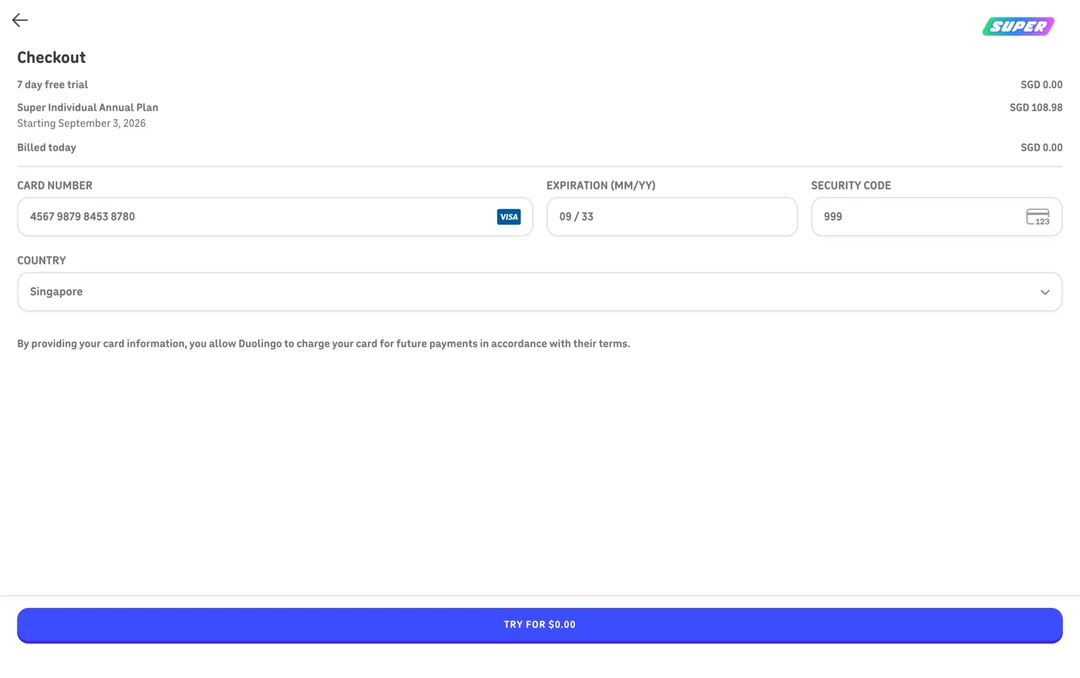
- 1
Note 1: The 16-digit card number shows as four groups of four. You can check it against your card one group at a time.
- 2
Note 2: The expiry date and the security code get their own boxes. Each one is a short piece, four digits for the date and three for the code.
Groups of four, plus two short boxes
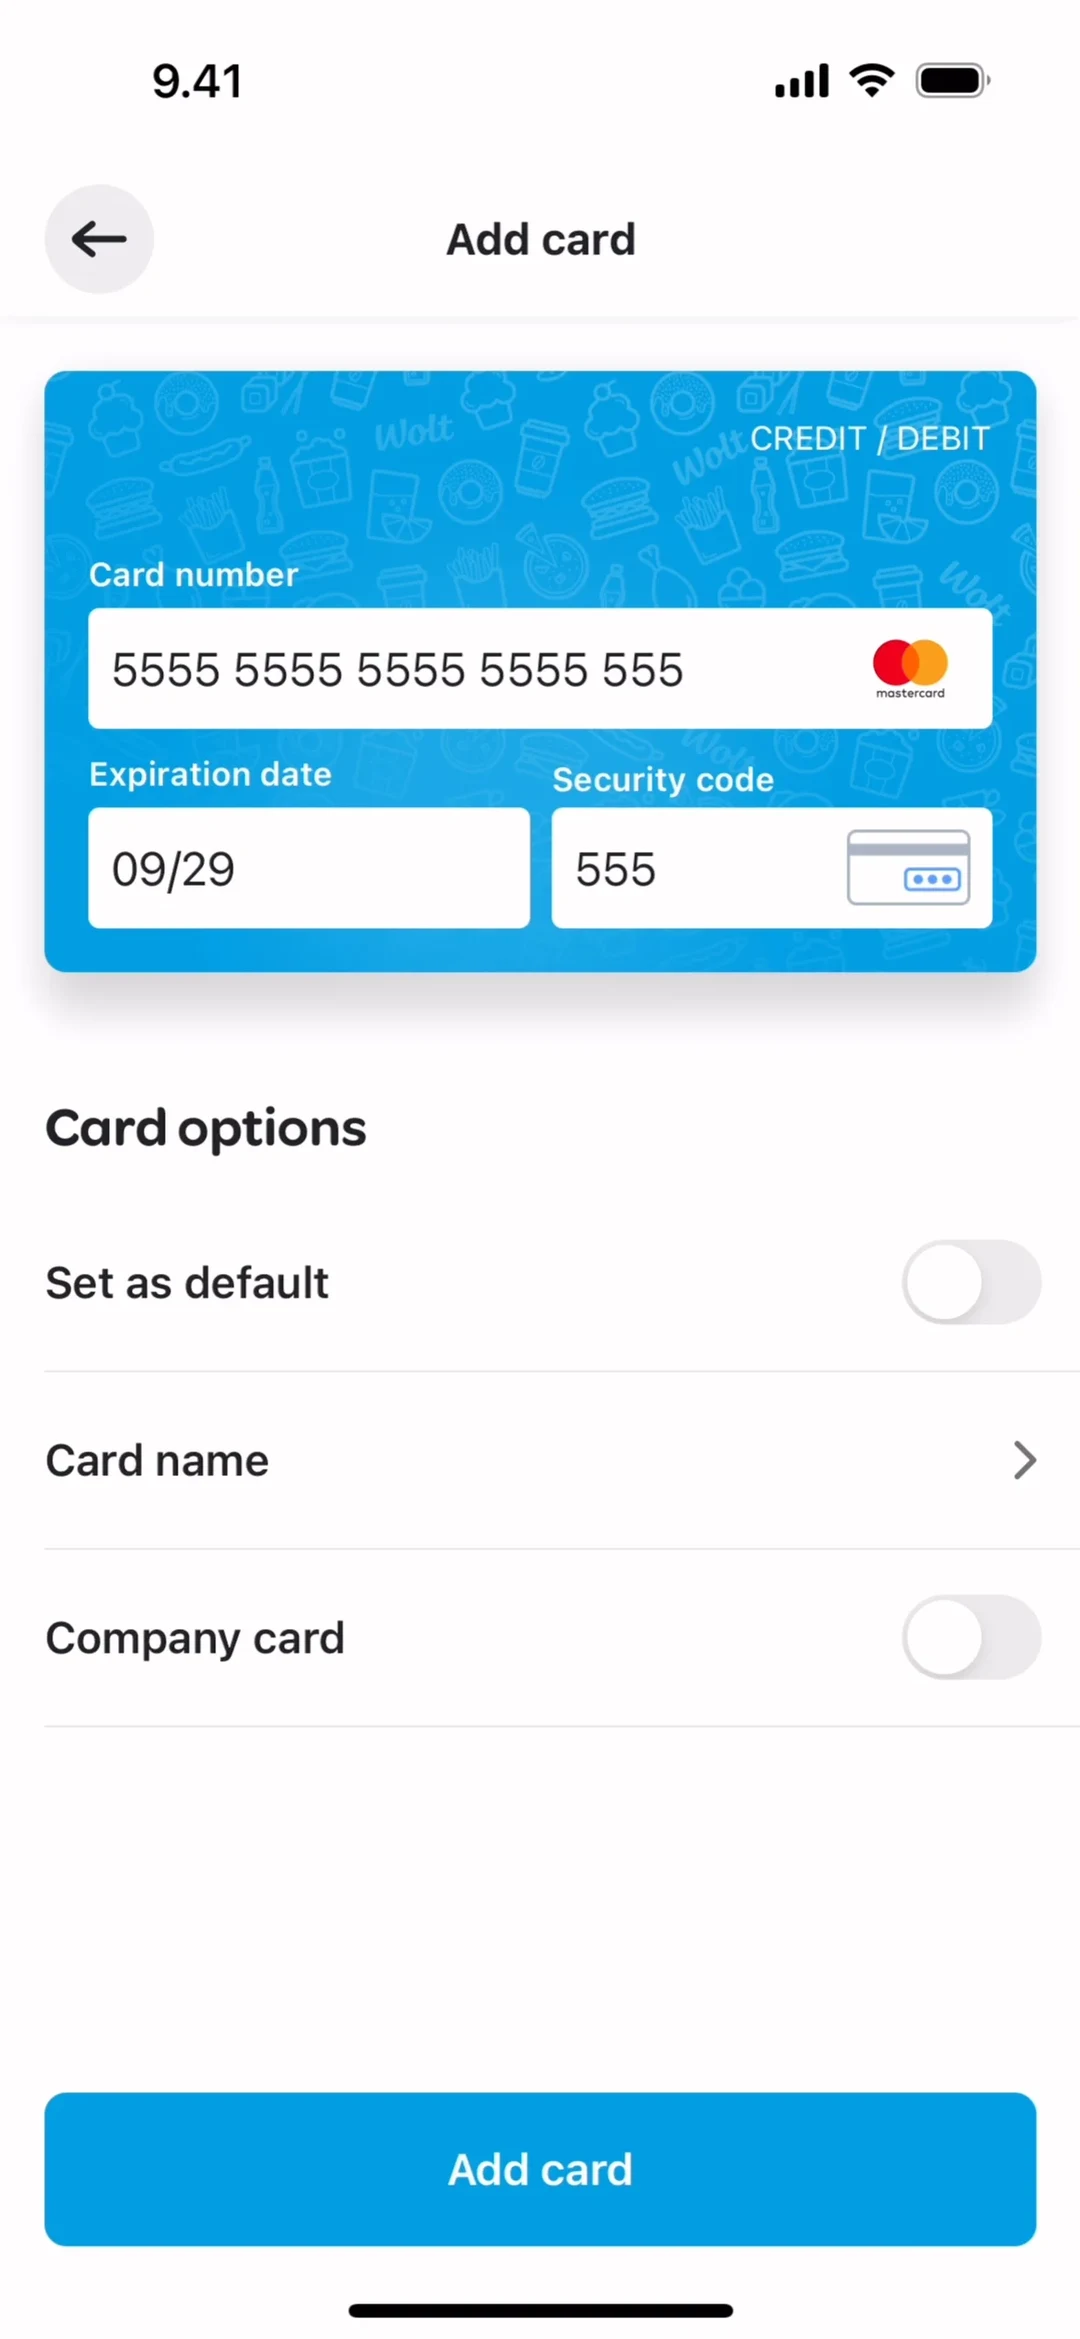
- 1
Note 1: The number is shown in groups of four with a space between each. Copying it from your card, you can keep your place group by group.
- 2
Note 2: The expiry date and the security code sit in two small boxes on the same card panel. Each is a short piece you can take in at a glance.
Groups make a slip easier to spot
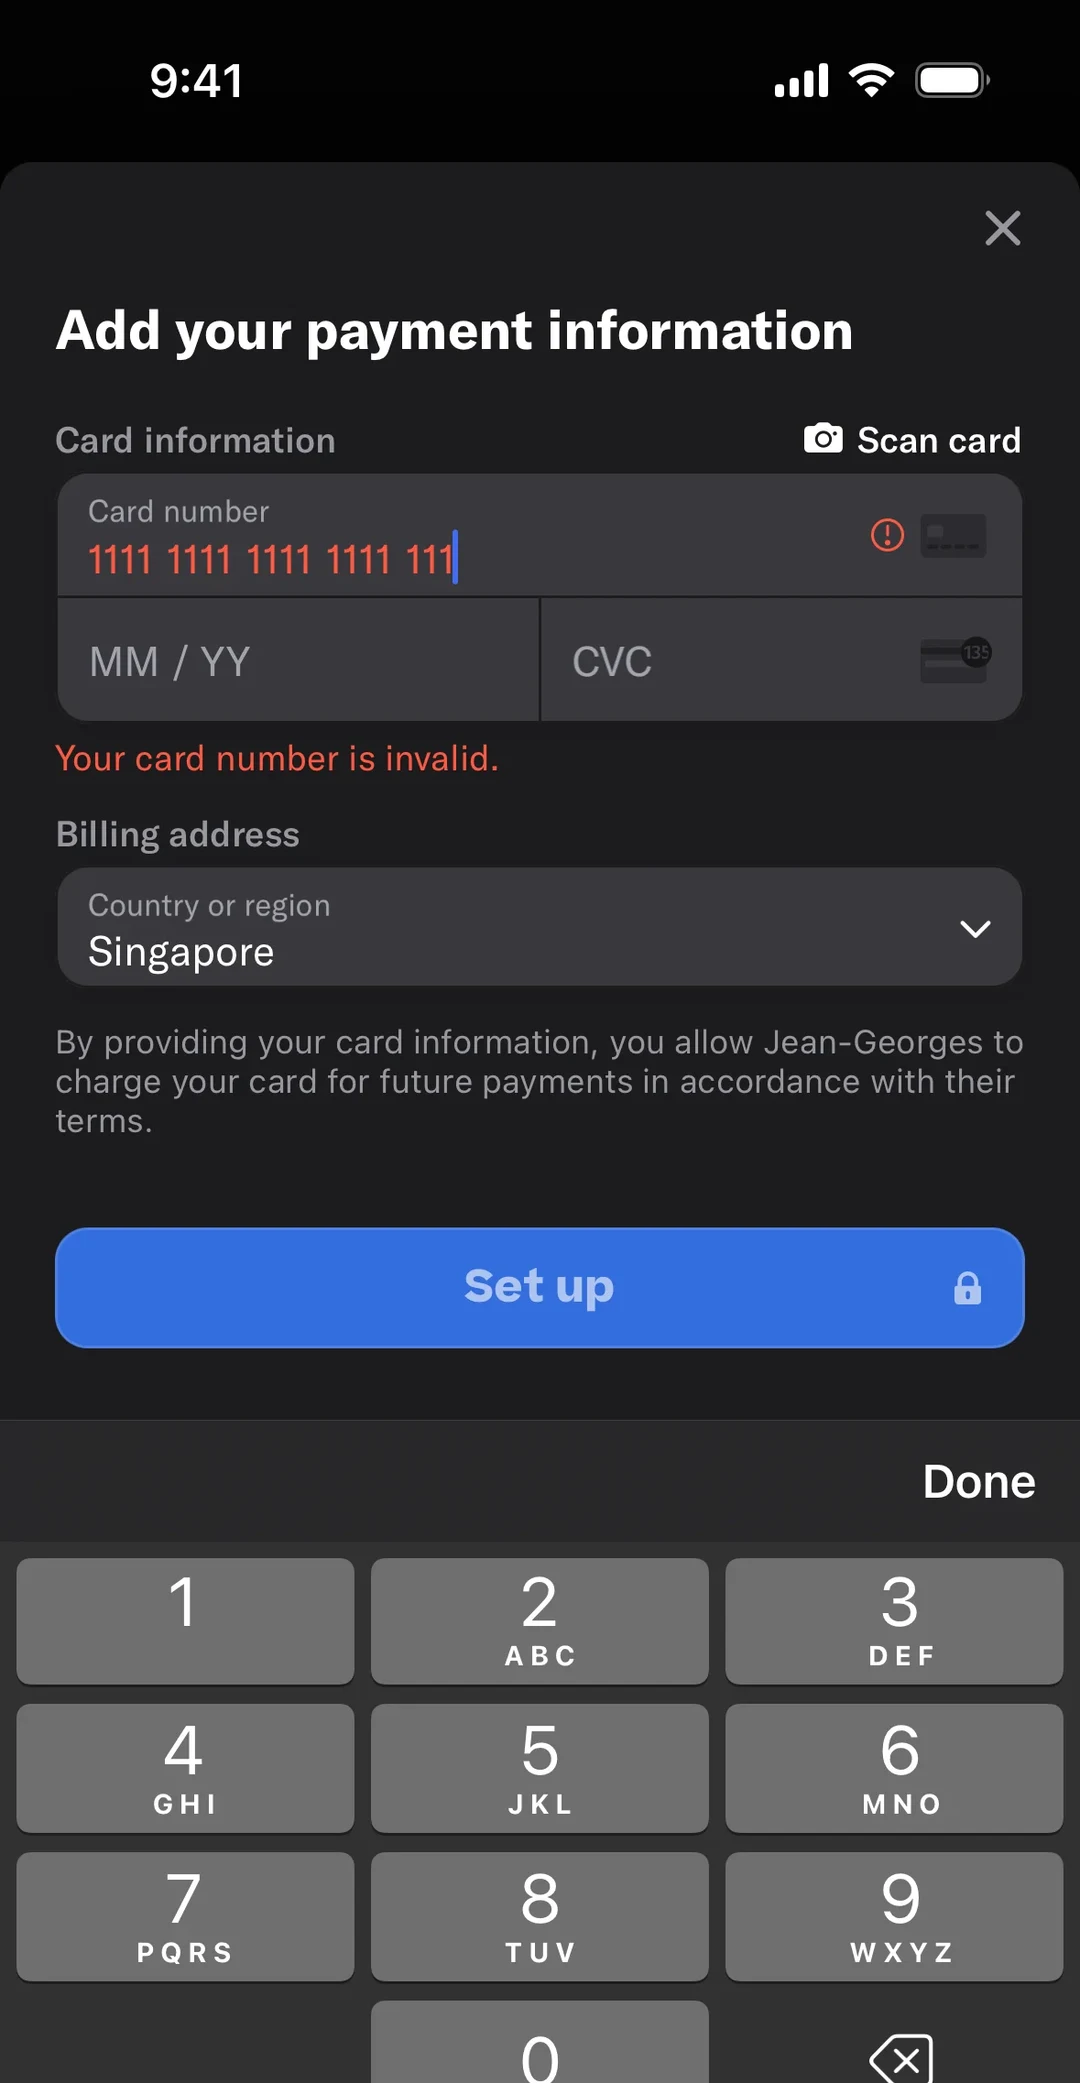
- 1
Note 1: The number is typed in groups of four, and the last group has only three digits. Without counting every digit, you can see where the number stops.
- 2
Note 2: “Your card number is invalid.” appears in red. Because the digits are in groups, you can compare them with your card group by group to find the slip.
- 3
Note 3: The expiry date and the security code are two more short boxes, still empty. The card number is the only long thing on the screen.
5. The Doherty Threshold
The Doherty Threshold says people get far more done once a computer replies to each command in under a second. It comes from a 1982 report by Walter Doherty and Arvind Thadhani at IBM.
When businesses first put people in front of computers, psychologists argued that two seconds was the longest anyone should wait for a reply, and designers worked to that. The comforting thought was that the wait cost nothing, because the person was using those seconds to plan their next step anyway. Doherty and Thadhani's report (opens in a new tab) says that thought was wrong. It uses measurements Thadhani made of programmers working at terminals, which were a screen and keyboard wired to a big shared computer.
Every command a programmer typed and every answer the computer sent back made up one transaction. Thadhani counted how many transactions programmers got through in an hour. When the computer took 3 seconds to answer, they finished about 180, which is one every 20 seconds. When it answered in 0.3 seconds, they finished 371, one every 9.7 seconds. That's 106 percent more work in the same hour.
The faster answer saved far more than the 2.7 seconds cut from the computer's wait. Each transaction got about 10 seconds shorter. The rest of the saving came from the programmers themselves: the pause between getting an answer and typing the next command fell from 17 seconds to 9.4. The report's explanation is that people keep the next few steps in mind while they work, and a long wait makes them lose that plan, so they have to think it through again. You've probably felt this when a page hangs and you forget what you were about to click.
You'll often see the threshold quoted as 400 milliseconds, which is under half a second. That number doesn't show up in the copy of the report that's online, which talks about replies of under a second. Kent Beck, writing about the threshold, calls the figure (opens in a new tab) a practically motivated threshold and not a universal constant of human attention. Treat it as a useful target.
See it in real products
Grey shapes stand in for the page
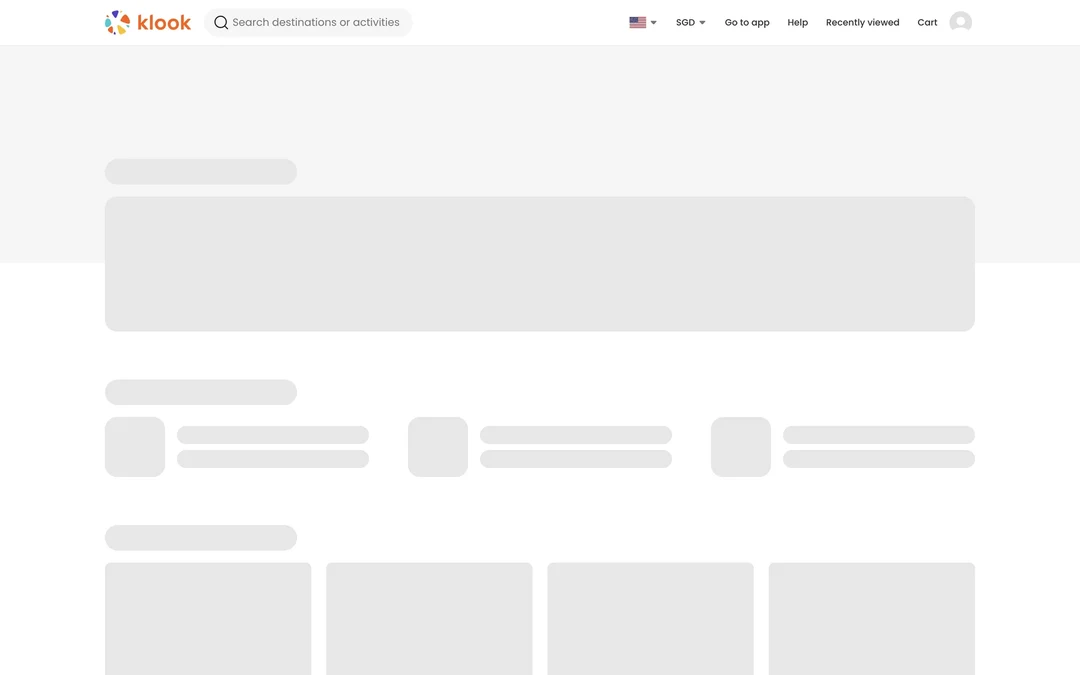
- 1
Note 1: The top bar is already in place, with the "Search destinations or activities" box and "Cart", while the rest of the page is still on its way.
- 2
Note 2: Grey blocks hold the place of the banner, rows and cards that are still loading. Your first answer comes in the shape of the page, instead of a blank screen.
A spinner inside the pressed button
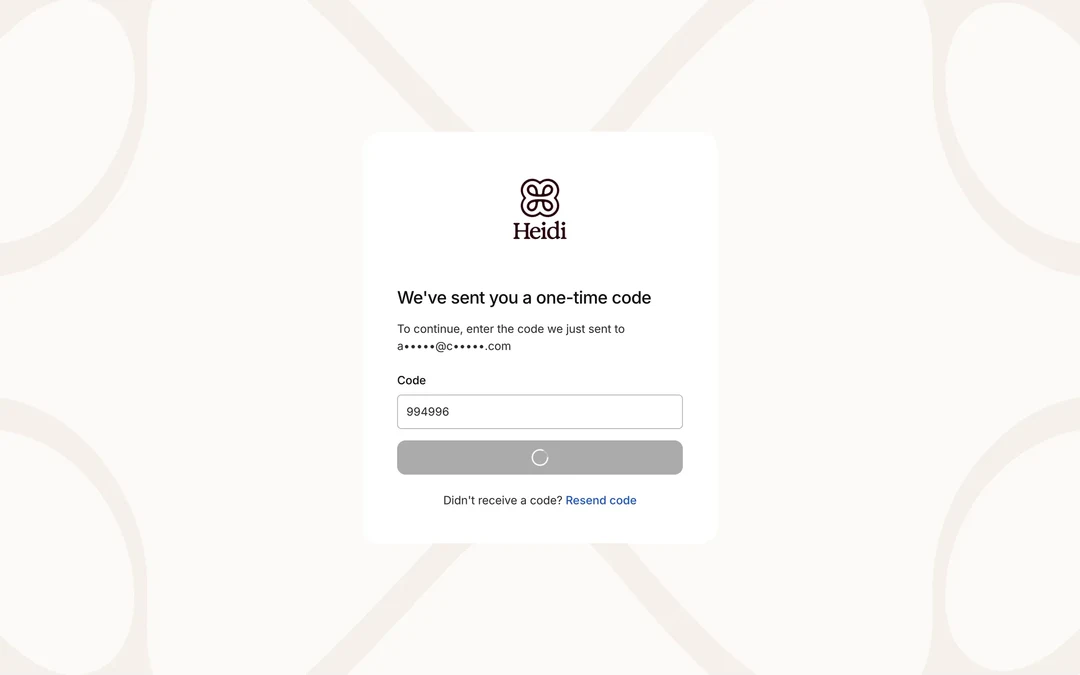
- 1
Note 1: The button is grey and shows a spinner where its label would be. That tells you your tap registered, even while the code is still being checked.
A progress bar for a slower job
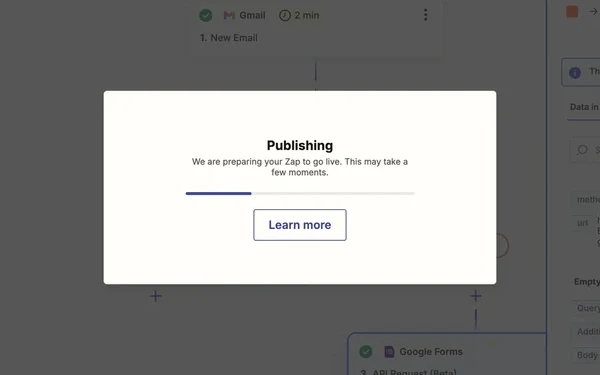
- 1
Note 1: The bar shows how far the publishing has got. For a job longer than a second, a bar like this gives you a quick answer and a sense of progress.
- 2
Note 2: The words "This may take a few moments" tell you a wait is expected, so a pause doesn't look like a fault.
A spinner with a time limit
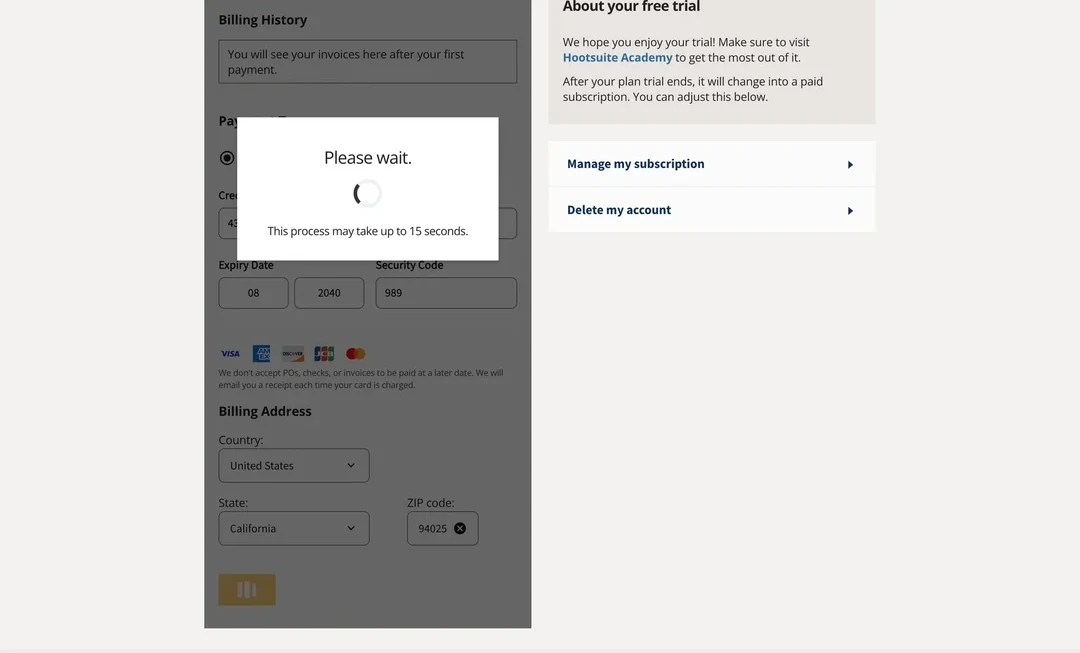
- 1
Note 1: The spinner tells you the work has started, but not how far along it is. Over a long wait, you can't tell whether it has stalled.
- 2
Note 2: Saying "up to 15 seconds" tells you how long to expect before the wait starts. You get an answer now, even though the job itself may take many seconds.
6. The Aesthetic-Usability Effect
The aesthetic-usability effect (opens in a new tab) says people judge attractive designs as easier to use.
A participant in a Nielsen Norman Group usability test shopped on the Fitbit site and ran into problems that ranged from small annoyances to serious flaws in the navigation. She finished her task, but with difficulty. Afterward she rated the site's ease of use very highly. Asked for feedback, she talked only about the look: “It's the colors they used. Looks like the ocean, it's calm. Very good photographs.”
The effect was first studied in human-computer interaction in 1995, when Masaaki Kurosu and Kaori Kashimura at the Hitachi Design Center had 252 participants rate 26 variations of an ATM interface for ease of use and for appeal. Ratings of appeal matched ratings of perceived ease of use more closely than they matched actual ease of use. The effect has a limit: a pretty design can make users forgive minor problems, but not large ones.
See it in real products
Fitbit's calm colours in early 2017
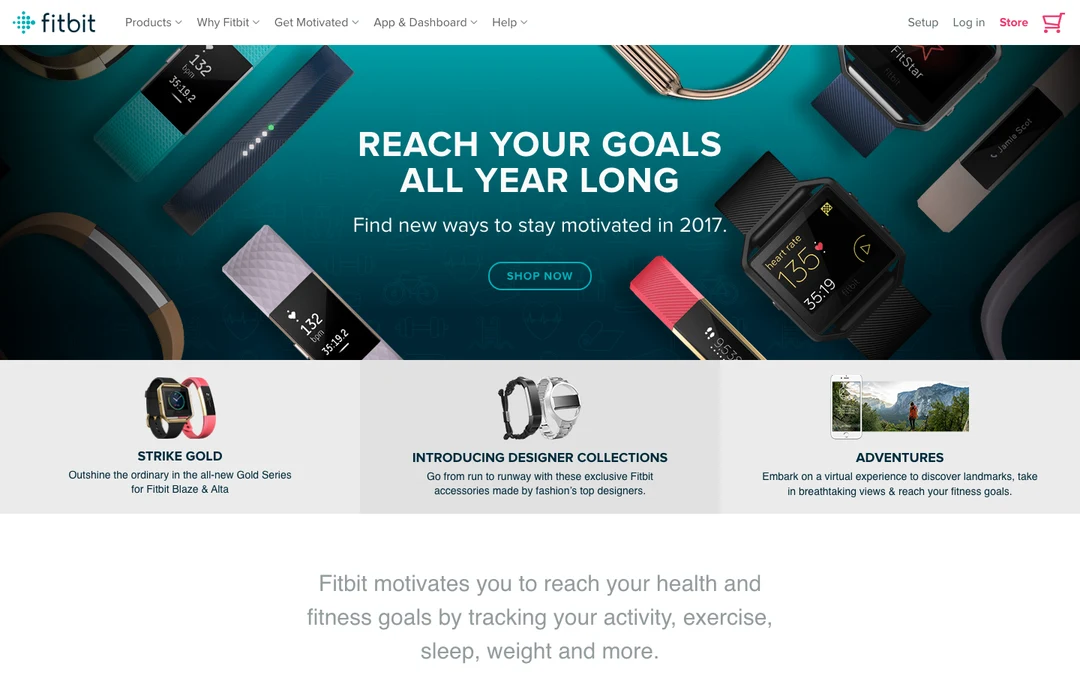
- 1
Note 1: Deep teal and big photos of trackers fill the top of the page. A tester in a Nielsen Norman Group study praised the Fitbit site's colours: "Looks like the ocean, it's calm."
- 2
Note 2: These menus lead into the site. Nielsen Norman Group reported serious flaws in the site's navigation, yet the same tester rated it very easy to use.
Full-screen photos, then a change of mind

- 1
Note 1: Photos fill the screen. In a Nielsen Norman Group test of the Arcadis site, a tester first saw "this beautiful, colorful image". After struggling with several tasks, they said the full-screen image was "pretty awesome once… And probably annoying the second time." This is an earlier version of the site than the one Nielsen Norman Group pictured.
- 2
Note 2: The site's main sections sit behind this one "Menu" button. Apart from the photos, the first screen gives you one headline and a few dates to act on.
7. The Law of Proximity
The law of proximity says that things sitting close together look like they belong together. Max Wertheimer demonstrated it in 1923 (opens in a new tab) with a row of dots whose gaps alternated between 3 mm and 12 mm. People see pairs of dots, not an even row. He called it the Factor of Proximity and noted it isn't the only grouping factor, since similarity groups things too.
On the California EDD website, as Nielsen Norman Group described it in 2020, the Add button for listing employer information sat among the unrelated buttons for Next, Save as Draft and Cancel. It was close to buttons it had nothing to do with and far from the main area of the form, which made it hard to find. The same article on the proximity principle (opens in a new tab) adds that Previous and Next are related, so grouping those two would have helped.
See it in real products
A gap that sets search apart
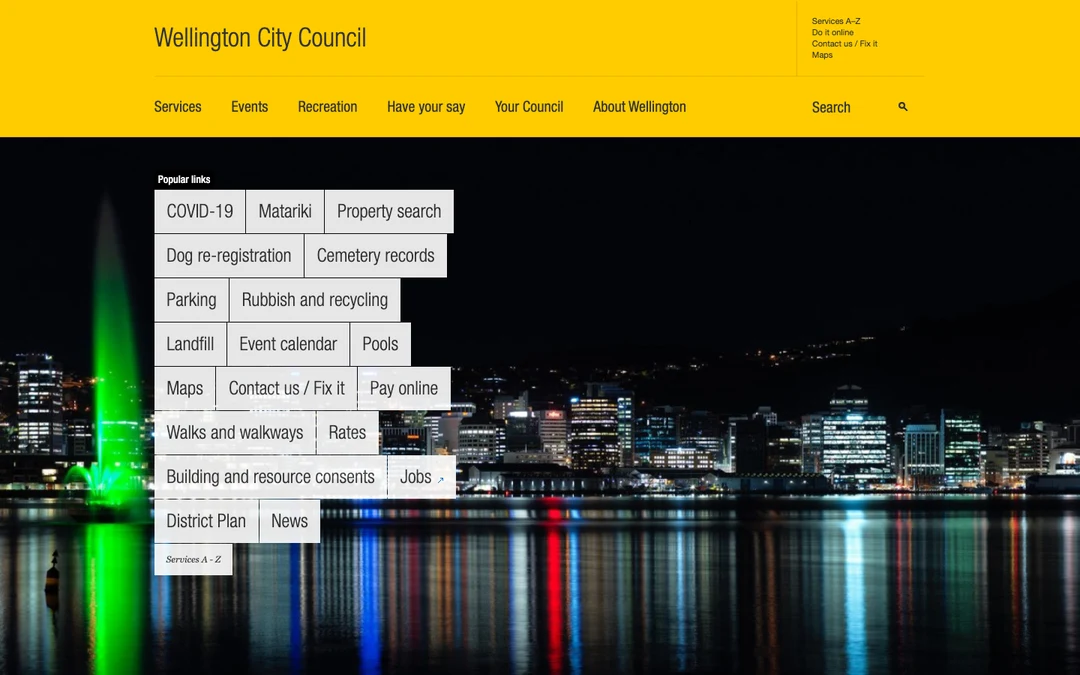
- 1
Note 1: The six main sections, from "Services" to "About Wellington", sit in one row with even gaps. You read them as one menu.
- 2
Note 2: A wider gap sets "Search" apart from the menu on the same line. Nielsen Norman Group pointed to this gap as what marks search as a different tool.
- 3
Note 3: The magnifying-glass icon sits far from the word "Search". Nielsen Norman Group noted that the label and its icon could be grouped more closely.
A Skip link far from the choices
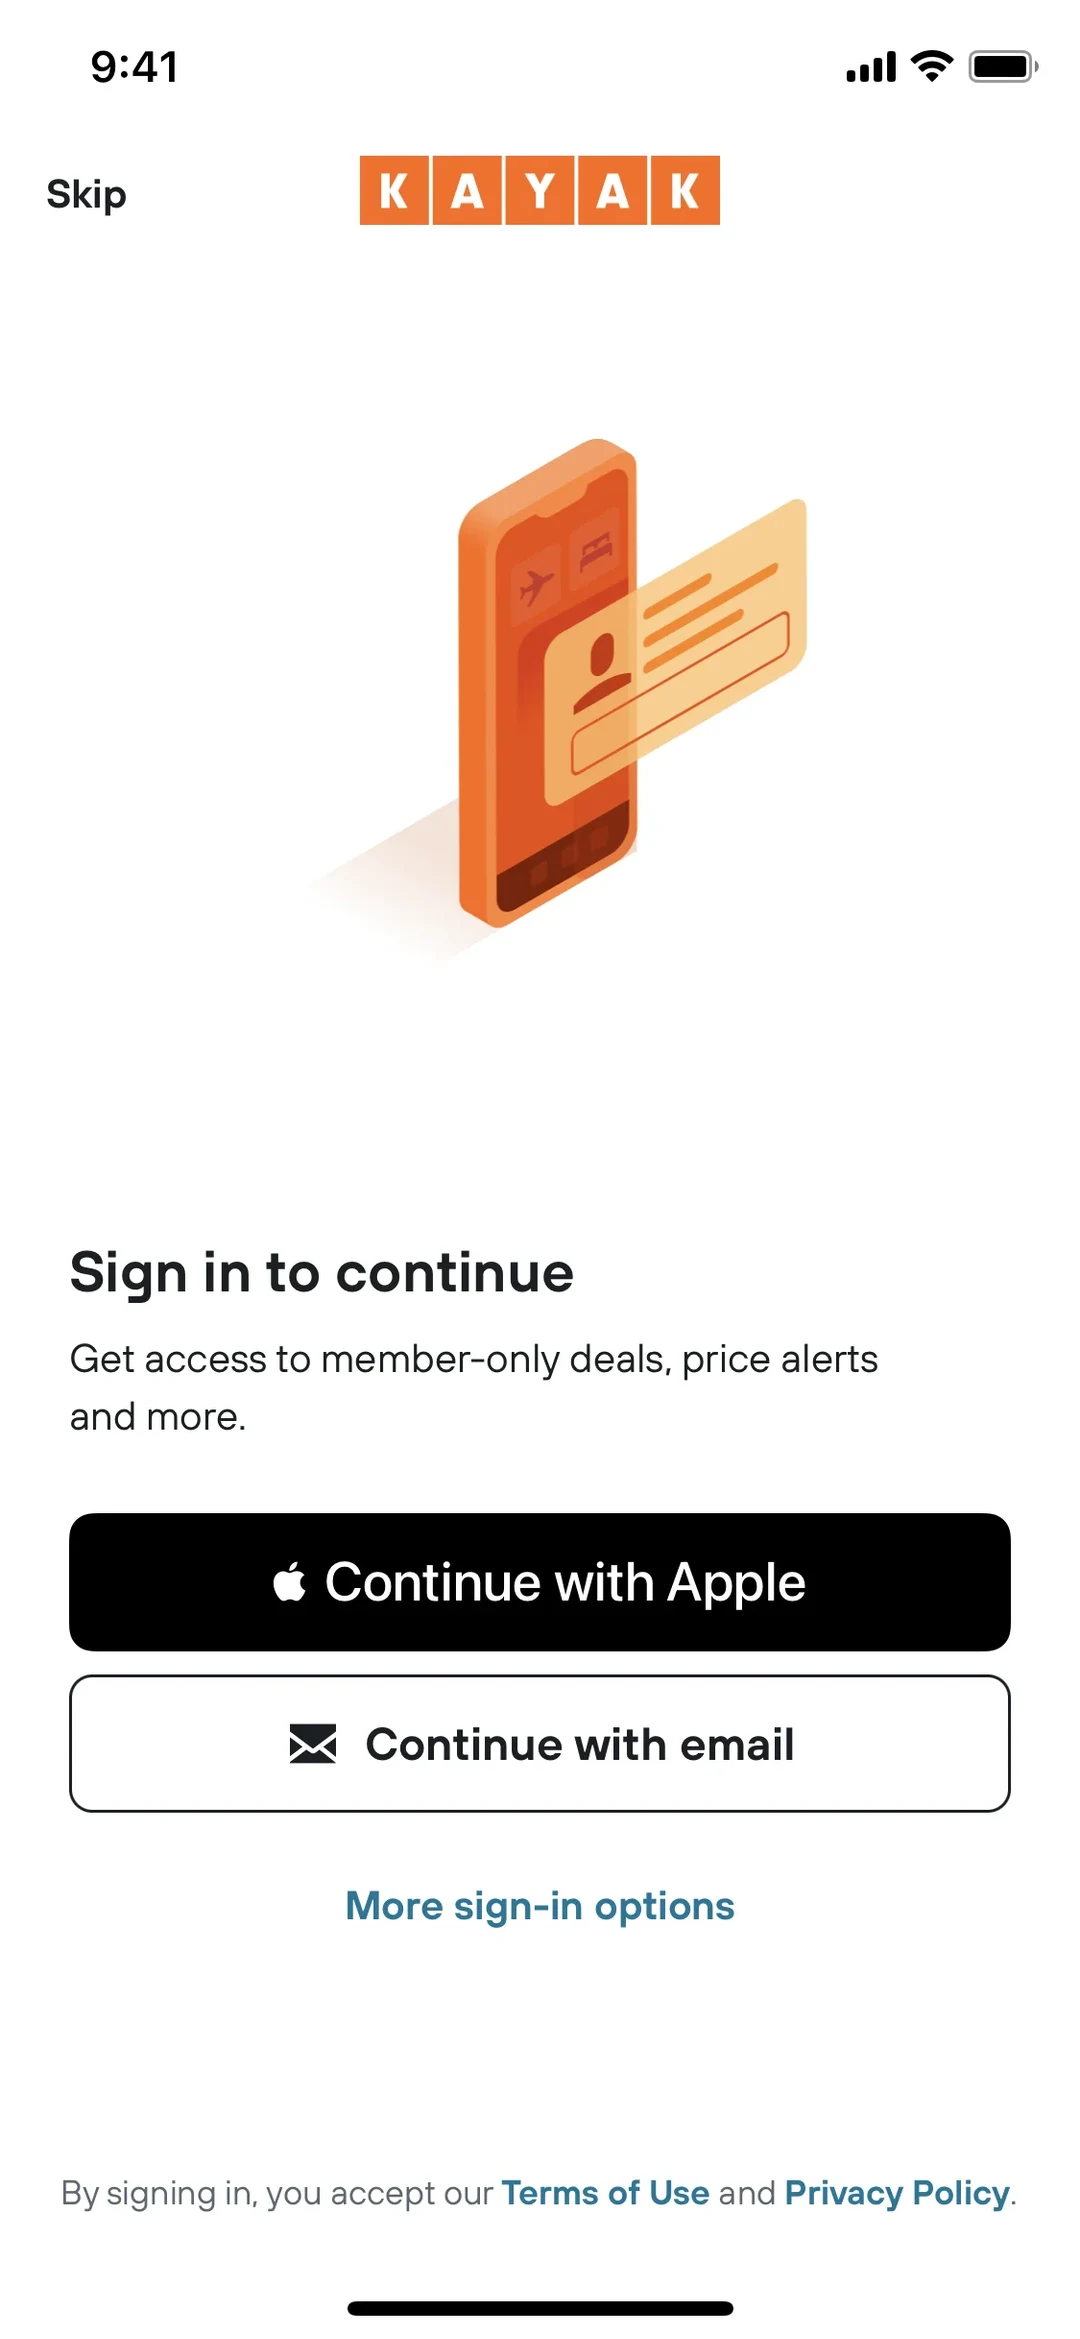
- 1
Note 1: The "Skip" link sits alone in the top corner, far from the sign-in choices. Nielsen Norman Group described the same Skip placement in an earlier version of Kayak's app as easy to overlook, and as making people think they must sign in. This is the newer screen.
- 2
Note 2: Every way to sign in is stacked together here, near the bottom. Your eye looks for all your choices in this group, and "Skip" isn't in it.
Labels and fields kept in tight groups
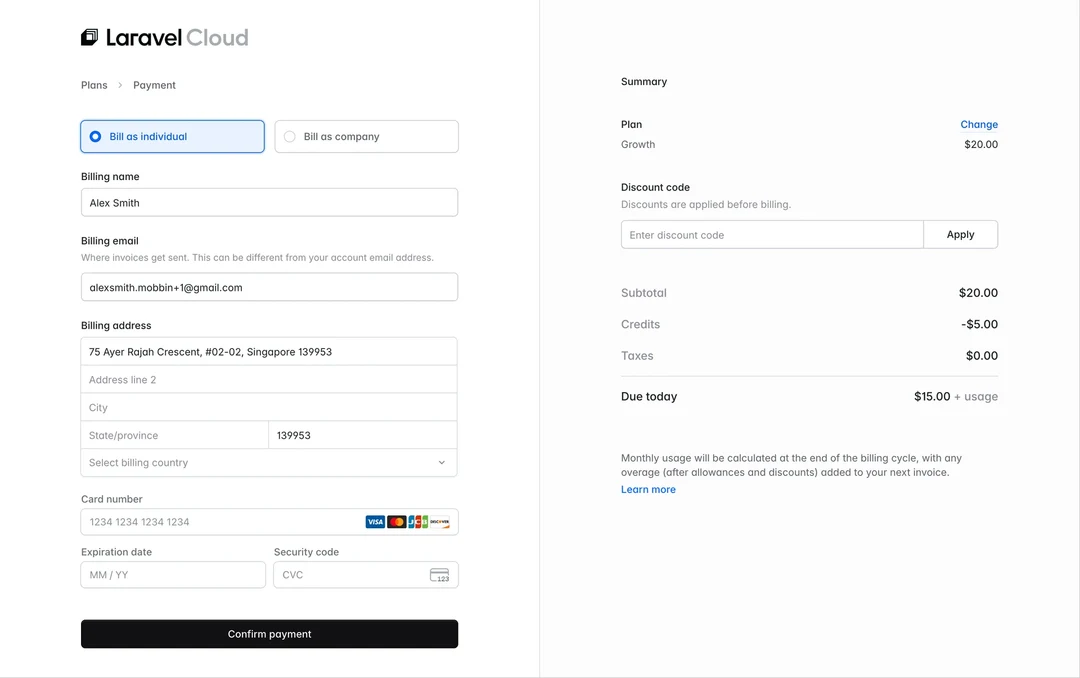
- 1
Note 1: Each label, like "Billing name", sits just above its own box, with a bigger gap before the next label. So it's clear which box each label names.
- 2
Note 2: All the parts of the "Billing address" touch each other in one joined box. They read as one address, apart from the name above and the card below.
One even stack of boxes
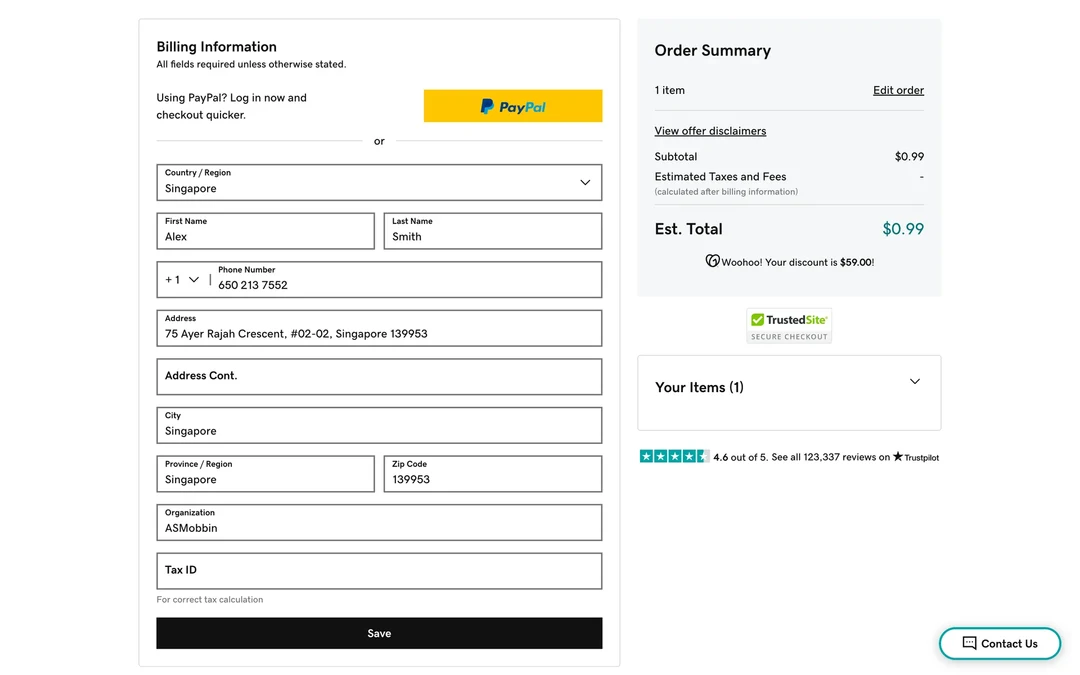
- 1
Note 1: Your name and phone sit as close to the address as the address lines sit to each other. With no bigger gap anywhere, the form reads as one long list.
- 2
Note 2: "Organization" and "Tax ID" have the same gap as the address boxes above them, so they look like more lines of the address.
8. The Peak-End Rule
The peak-end rule says people remember an experience mostly by its most intense moment and its end, not by the total. The idea traces back to a 1993 study (opens in a new tab).pdf) by Daniel Kahneman and colleagues. In it, 22 of 32 people chose to repeat a longer cold-water trial that ended slightly warmer over a shorter one.
In a randomized trial published in 2003, Donald Redelmeier, Joel Katz and Kahneman (opens in a new tab) studied 682 people having a colonoscopy. Half of them, chosen at random, had up to 3 minutes added at the end while the instrument's tip rested still, with no suction or inflation. Both groups reported nearly the same peak pain (8.1 and 8.0 on a scale of 0 to 10). But the group with the longer procedure rated its final moments as less painful (1.7 against 2.5). Over about five years, the odds that they came back for another colonoscopy were 1.41 times as high. Return rates averaged 50.4%, so the effect was real but modest.
See it in real products
How a lesson ends in Duolingo
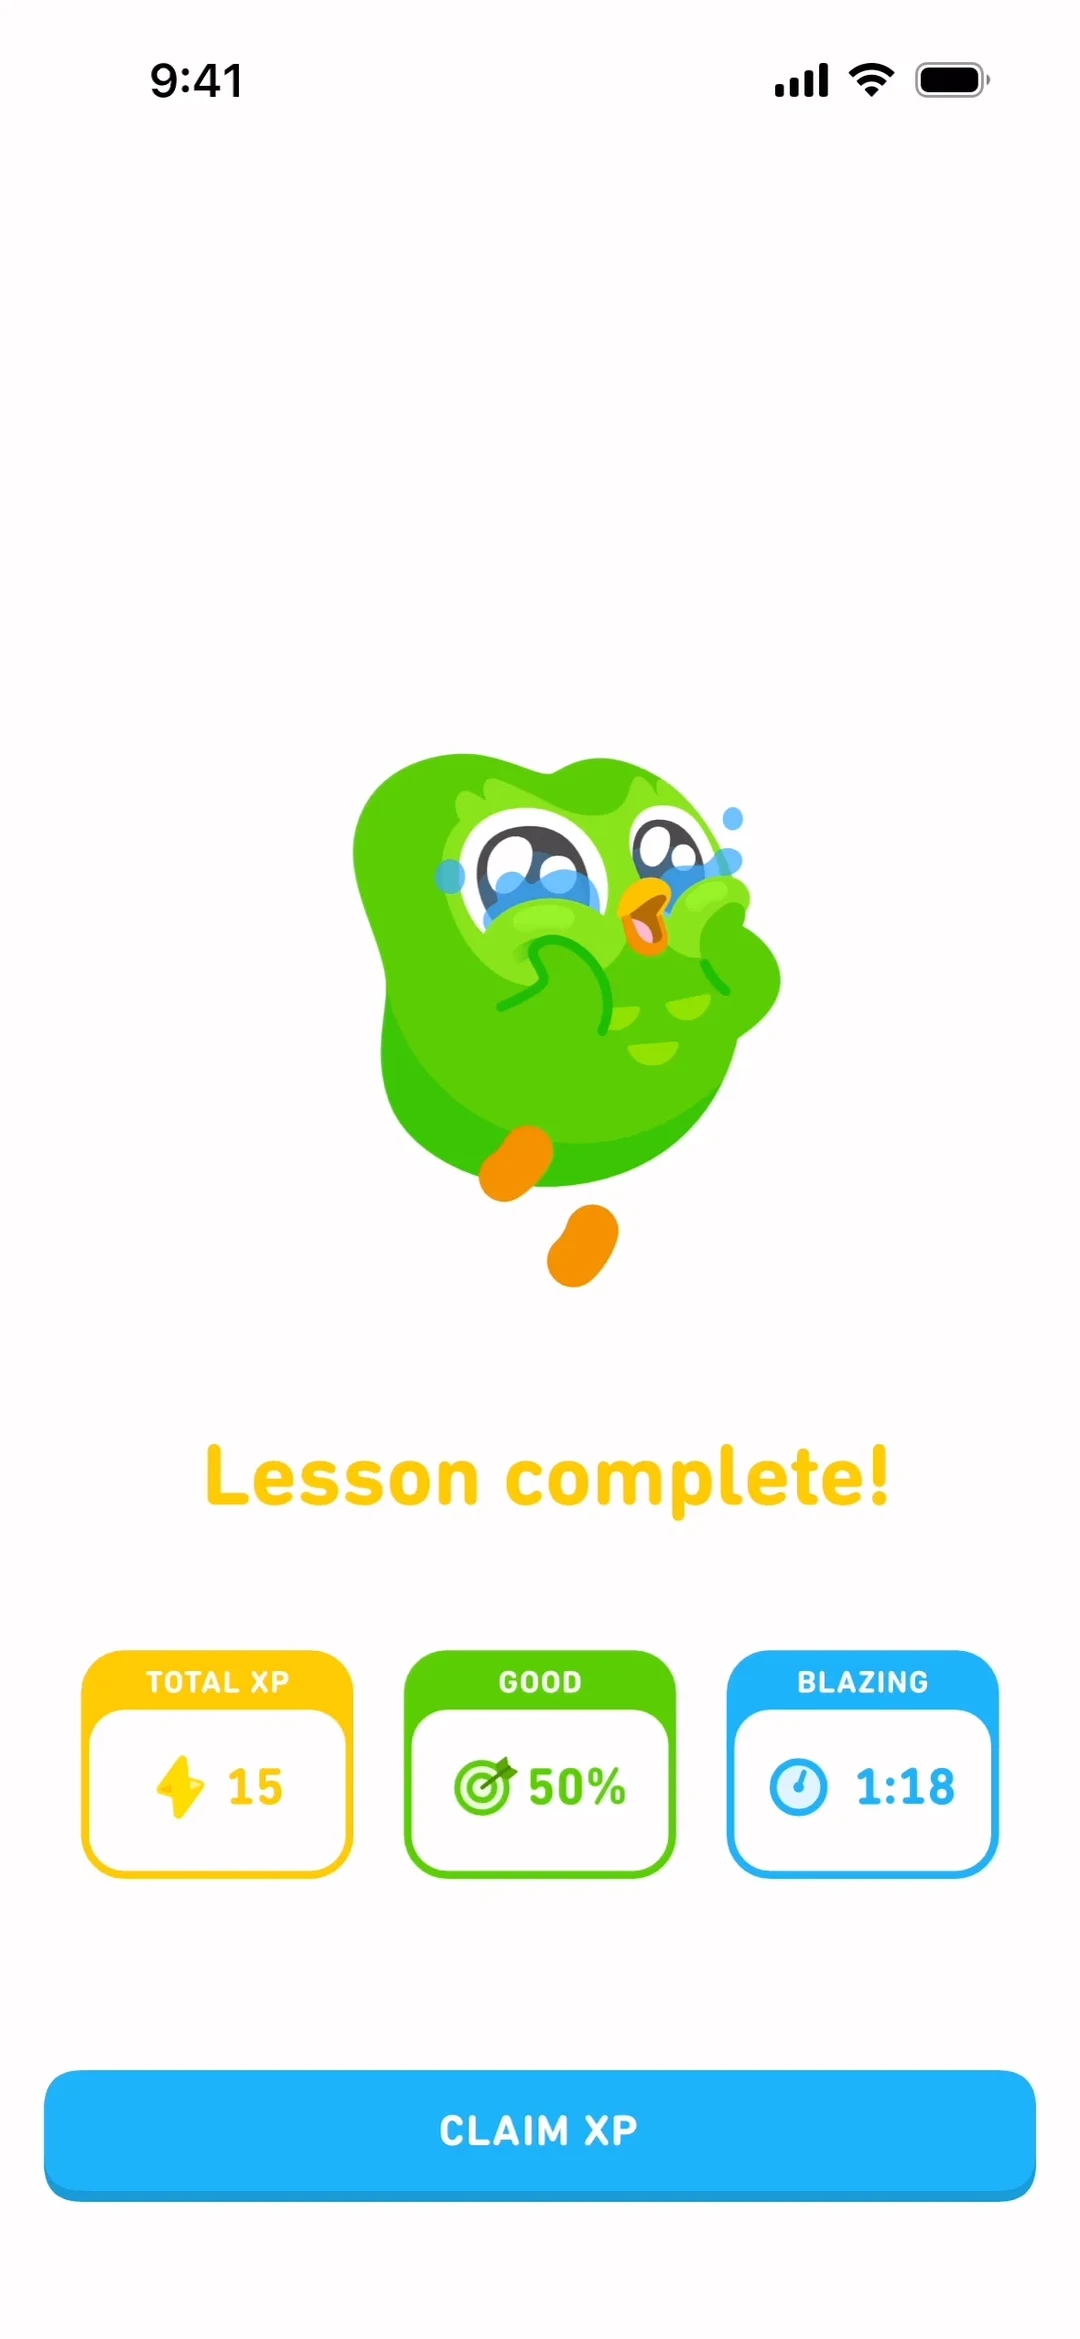
- 1
Note 1: The lesson closes on “Lesson complete!” in big letters under a happy owl. The last thing you see is a small celebration.
- 2
Note 2: The score here is 50%, and the label on its card says “GOOD”. The lesson ends on a kind word, and the end is what you tend to remember.
A purchase that ends with clear next steps
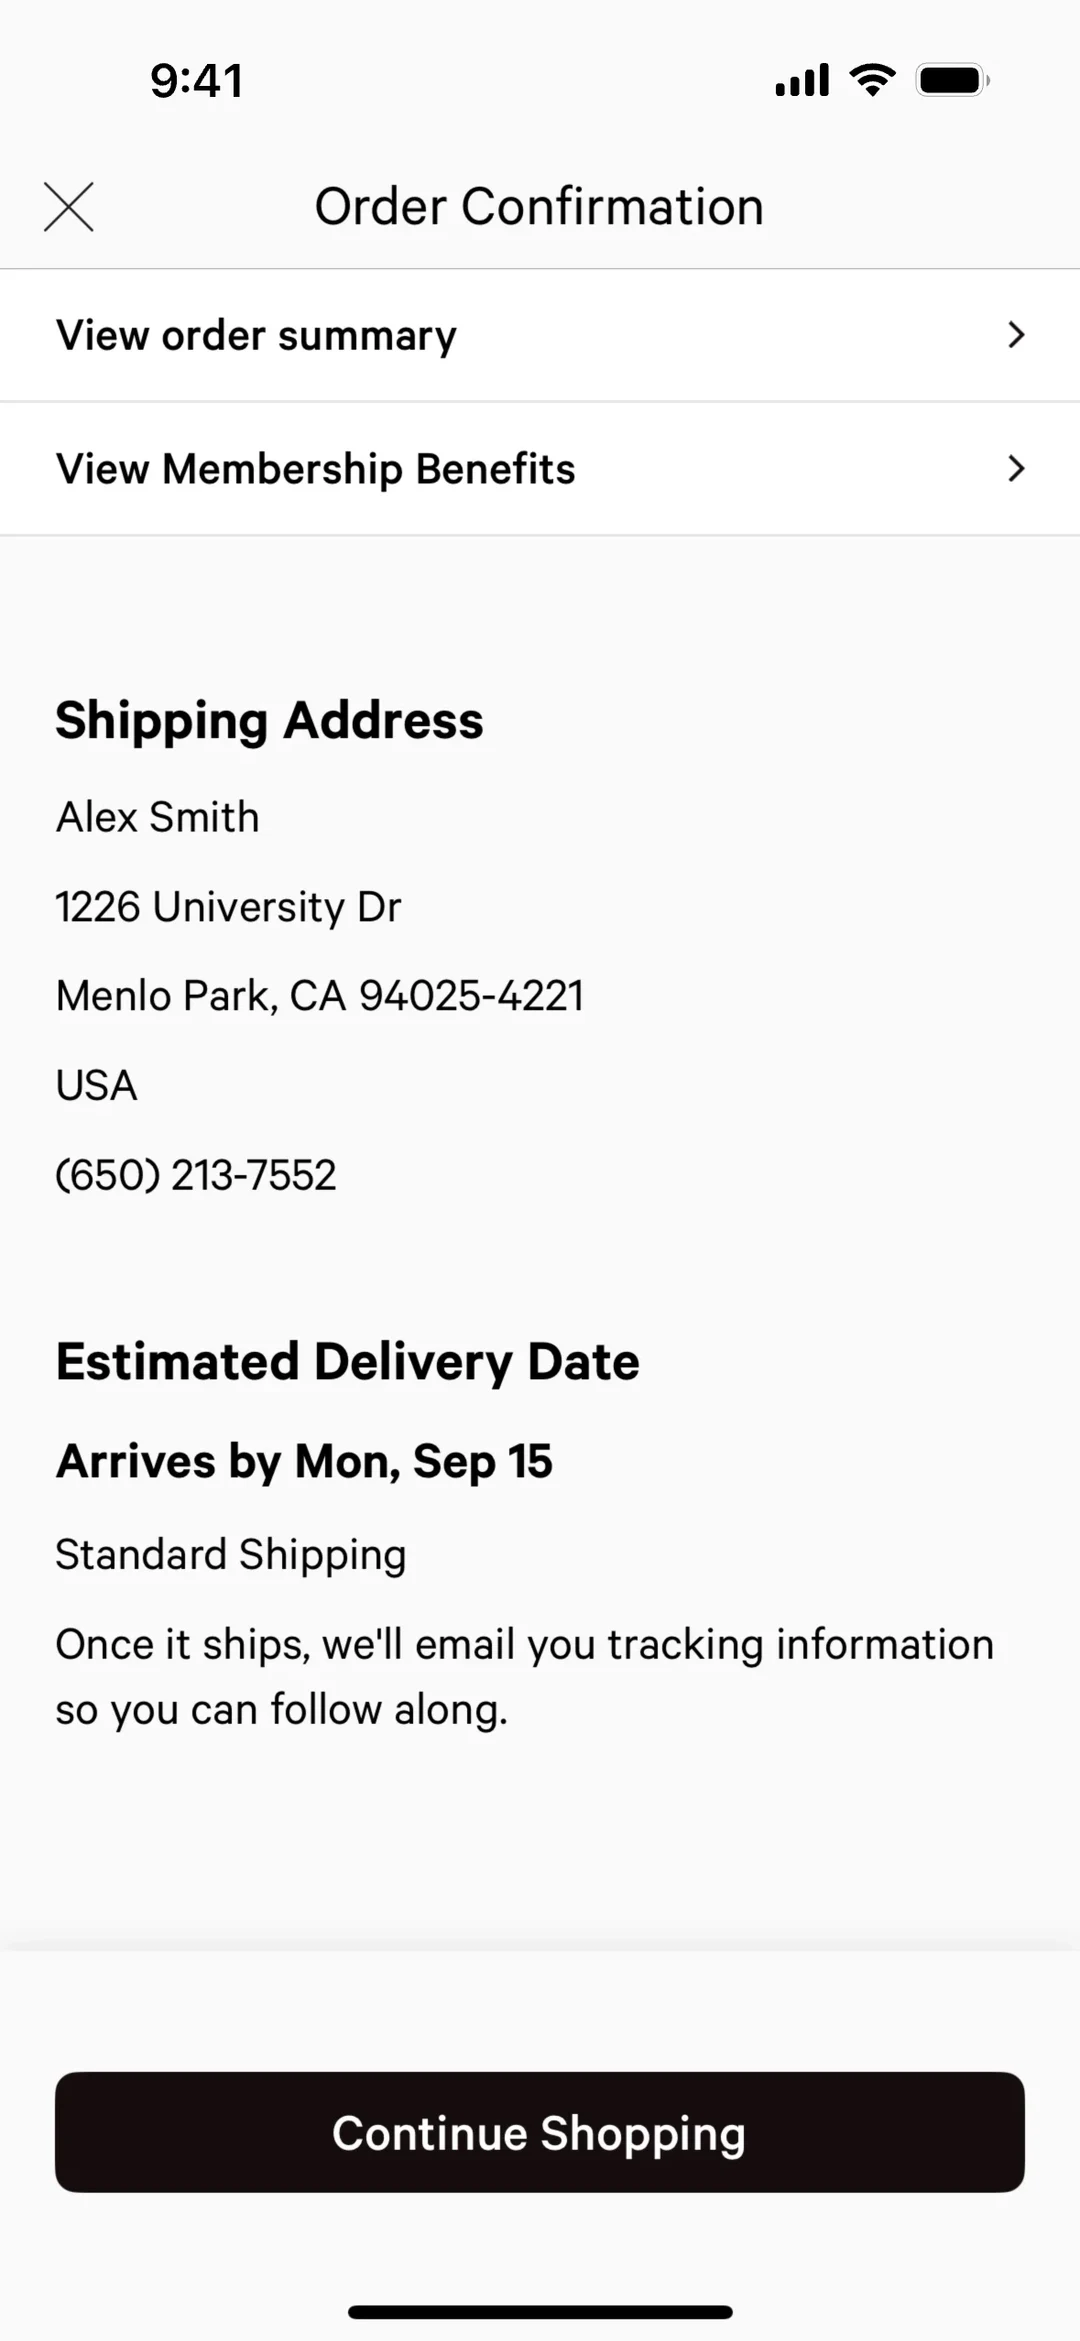
- 1
Note 1: The last screen of the purchase gives you a date: “Arrives by Mon, Sep 15”. You leave knowing what happened and when your order comes.
- 2
Note 2: This line says what comes next: “Once it ships, we'll email you tracking information so you can follow along.” You don't have to wonder what happens now.
A failed payment that answers your first worry
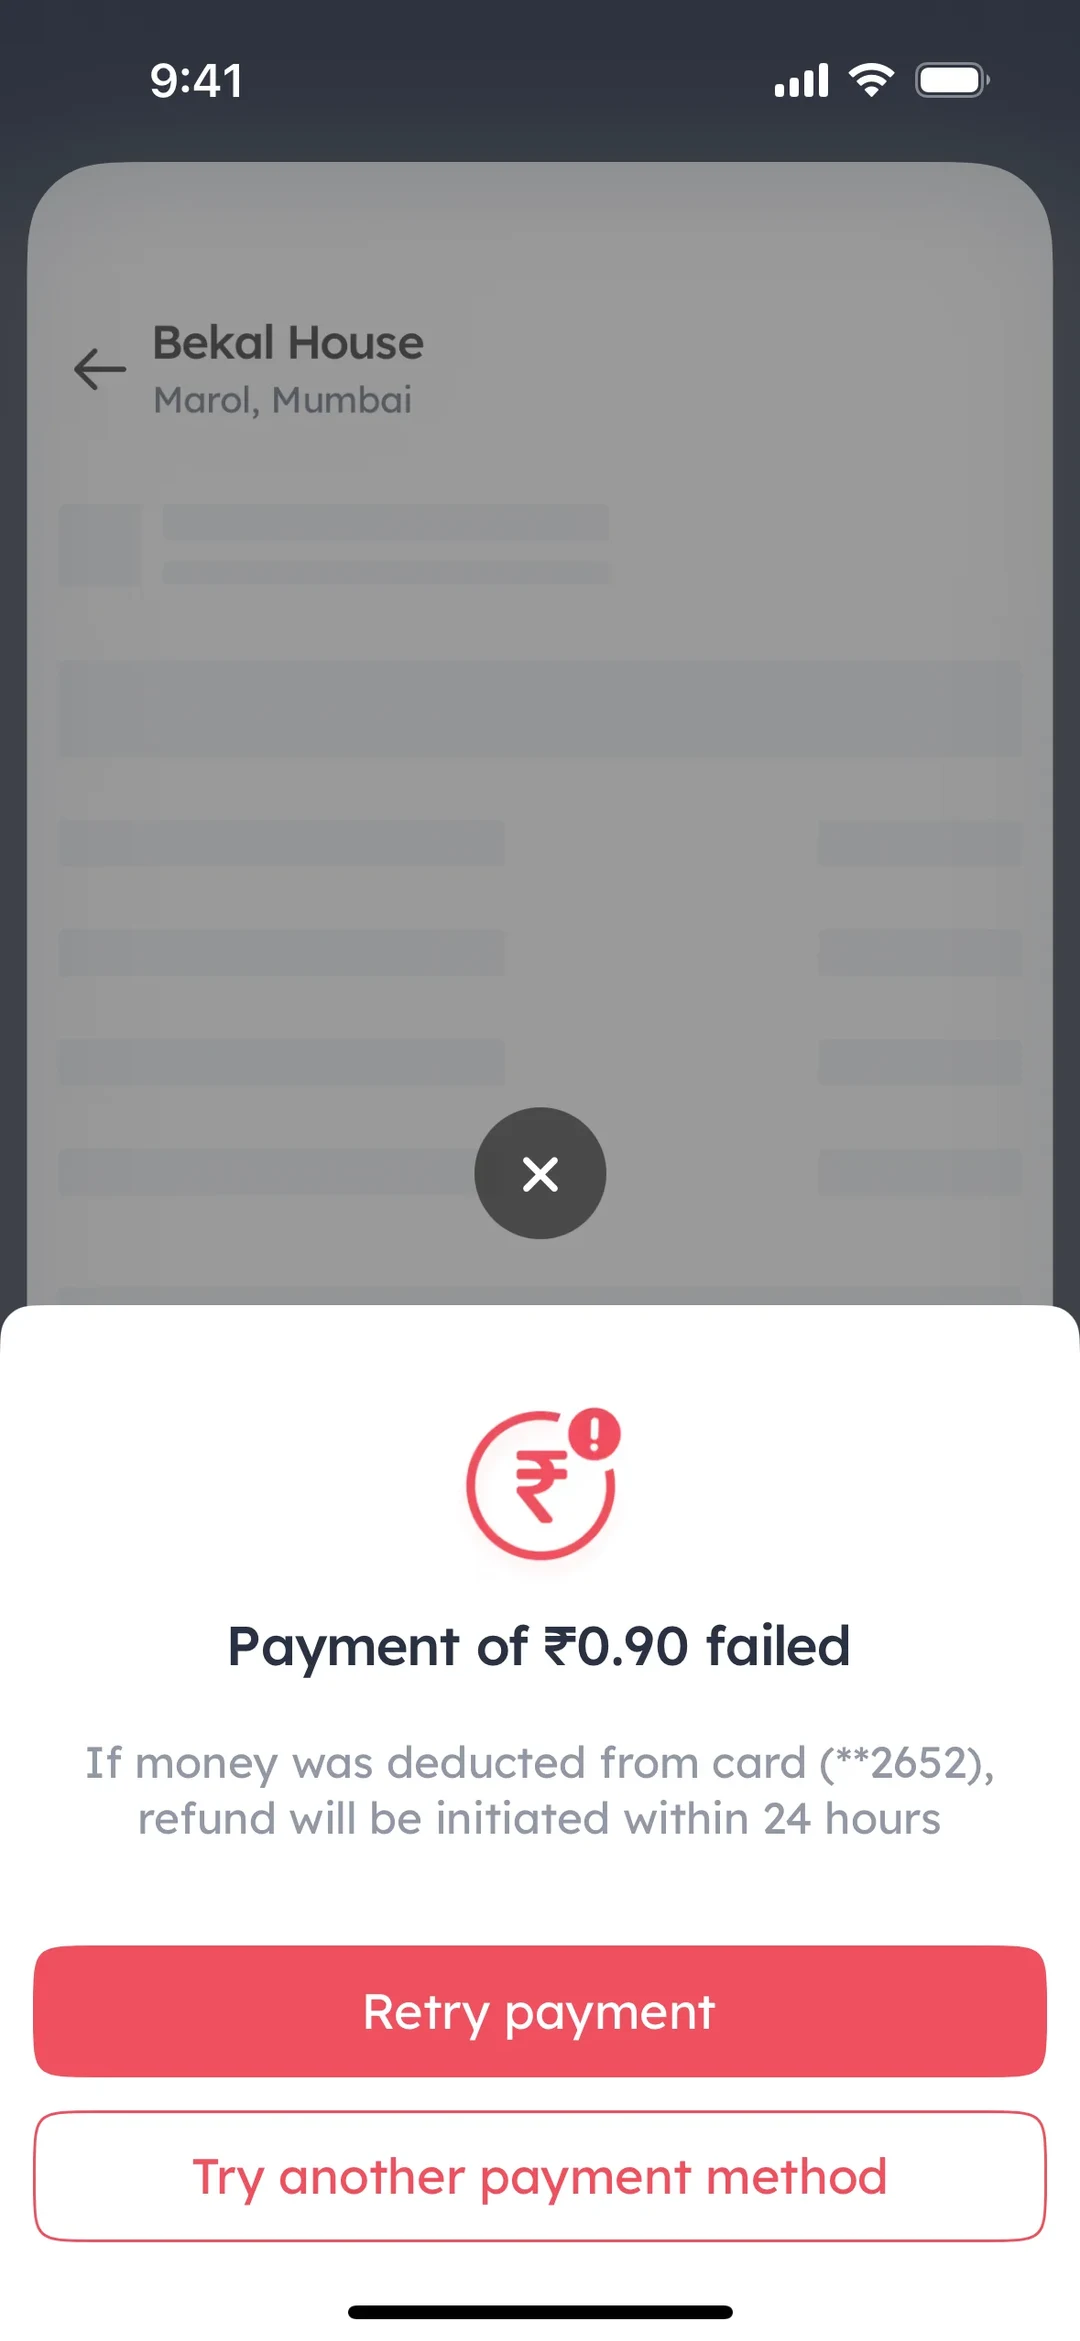
- 1
Note 1: A failed payment is often the roughest moment of an order. This line answers your first worry: if money left your card, a “refund will be initiated within 24 hours”.
- 2
Note 2: Two buttons sit under the bad news: “Retry payment” and “Try another payment method”. You see at once what you can do about it.
A failed payment left rough
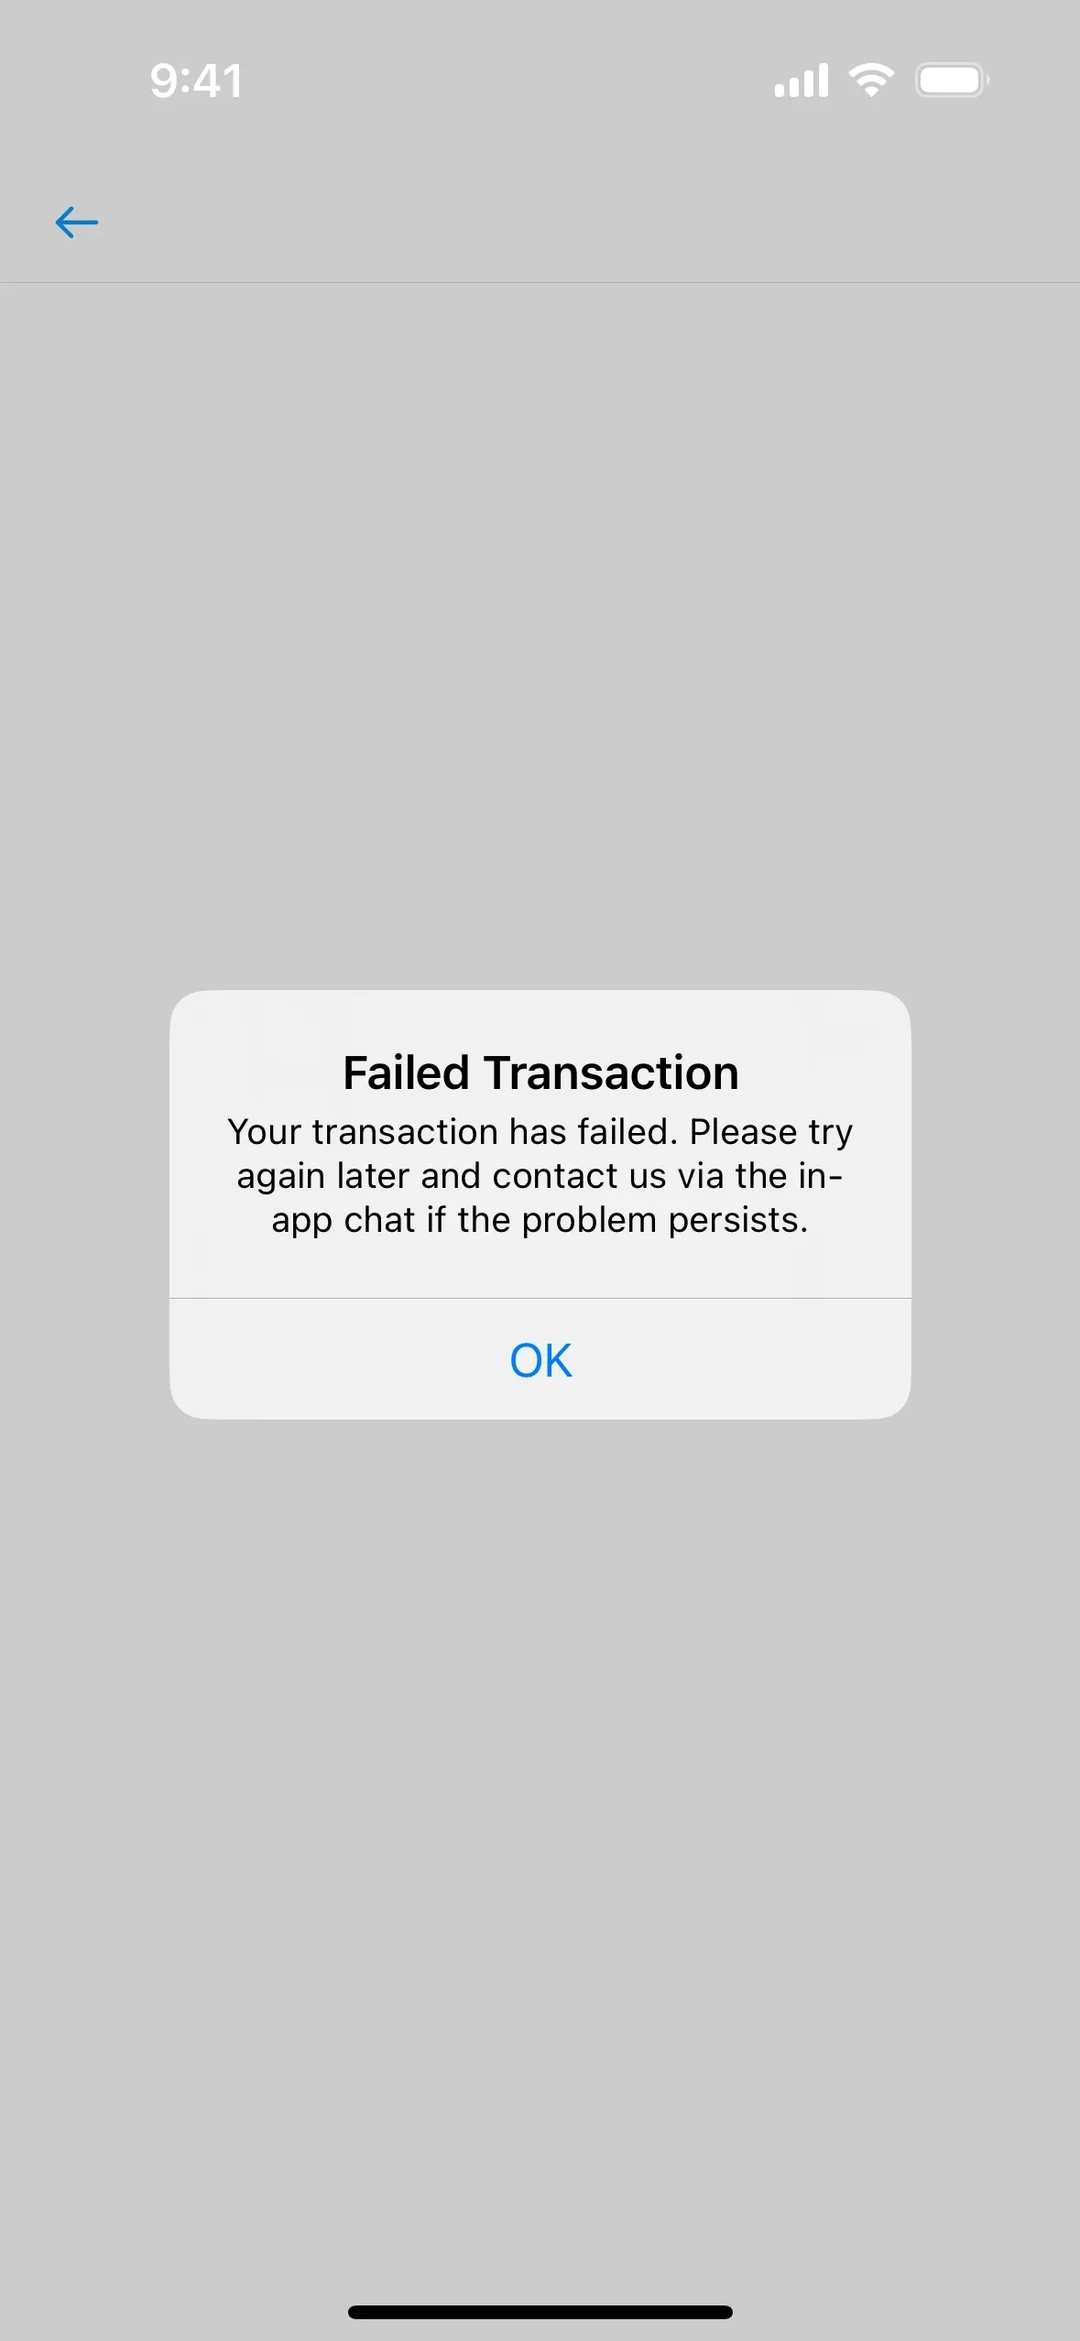
- 1
Note 1: The message says “Your transaction has failed” and asks you to “try again later”. It doesn't say why it failed or whether any money left your account.
- 2
Note 2: The only button is “OK”. Nothing on the screen takes you to the in-app chat it mentions, so the bad moment ends with no next step.
9. The Von Restorff Effect
The von Restorff effect, also called the isolation effect, says the one item in a list that differs from the rest is the one people remember best.
Hedwig von Restorff published her memory experiments in 1933. In one of her experiments, volunteers studied a list of 19 nonsense syllables and a single number, or 19 numbers and a single syllable, with the odd item in the middle. The odd item was remembered much better than its neighbors, and the advantage was far bigger than in her first lists, which held several odd items. A history of her work (opens in a new tab) sets out these experiments in detail.
Two limits matter for design. She measured memory for items in a list, not where people look or click, so applying it to a screen goes beyond what she tested. And the effect depends on rarity: it grew when her lists held fewer odd items. Her own explanation also put weight on the plain items, which interfere with one another because they resemble each other.
See it in real products
One plan marked, one button filled
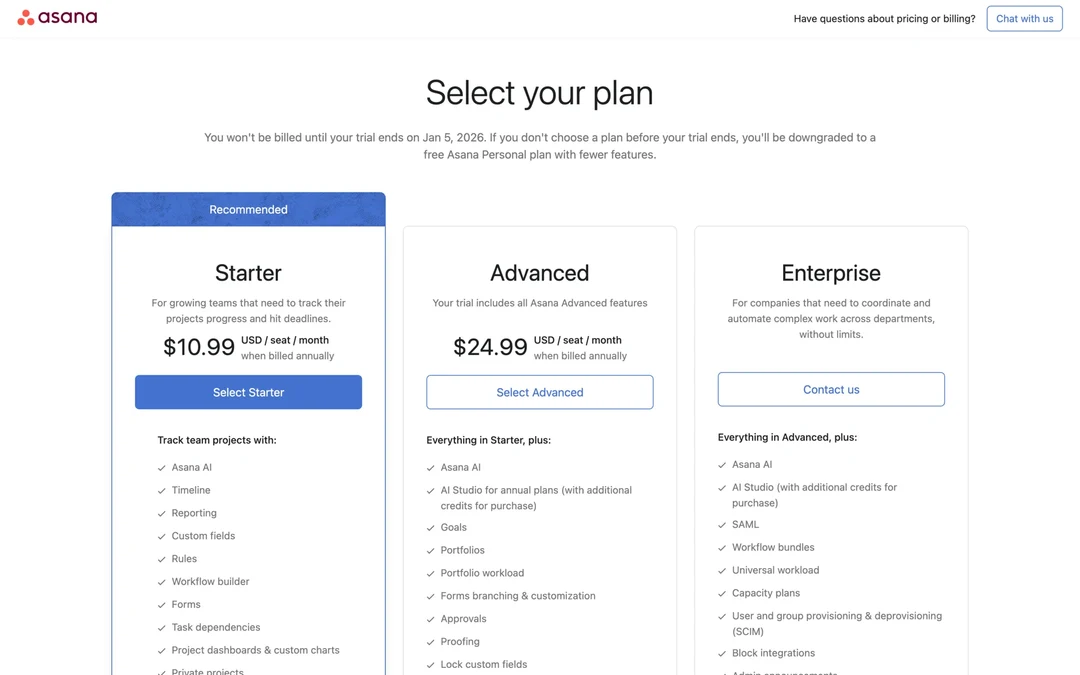
- 1
Note 1: Only the Starter card has a blue “Recommended” band on top. The other two cards are plain white, so Starter is the one that looks different.
- 2
Note 2: “Select Starter” is the only filled blue button on the page.
- 3
Note 3: “Select Advanced” and “Contact us” are outlined. Because they look alike, the one filled button is easy to pick out.
A highlighted plan with look-alike buttons
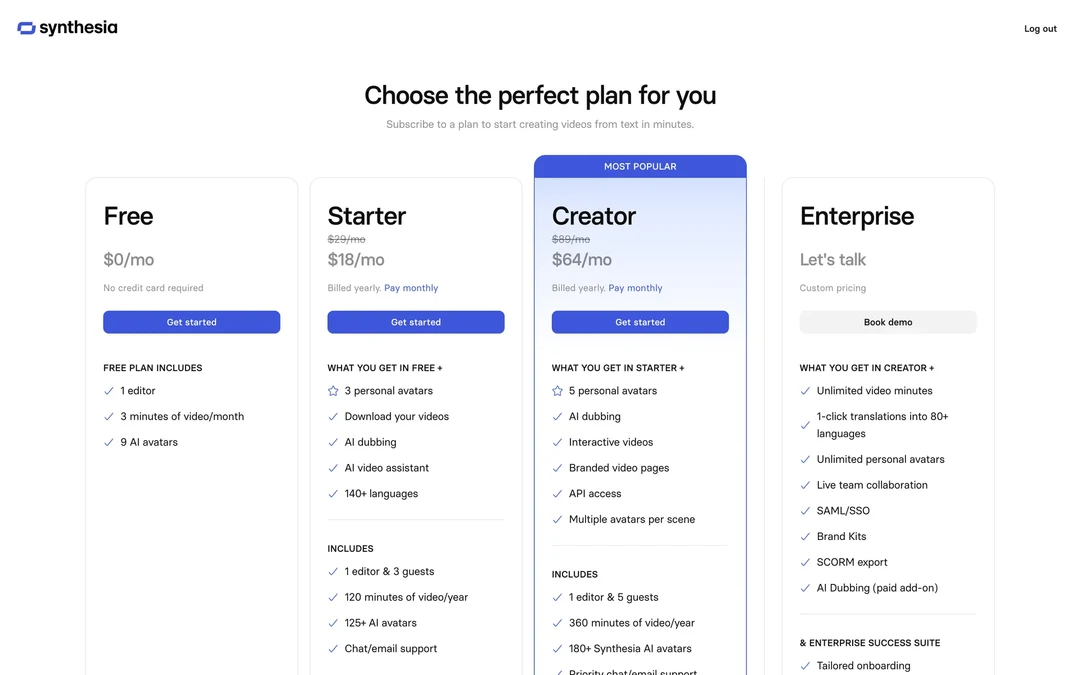
- 1
Note 1: The Creator plan gets a “MOST POPULAR” band, a blue border and a tinted card. Those marks make it look different from the other three plans.
- 2
Note 2: But Free, Starter and Creator all have the same filled blue “Get started” button. With three buttons alike, the Creator button stands out less than its card does.
When every card has the same badge
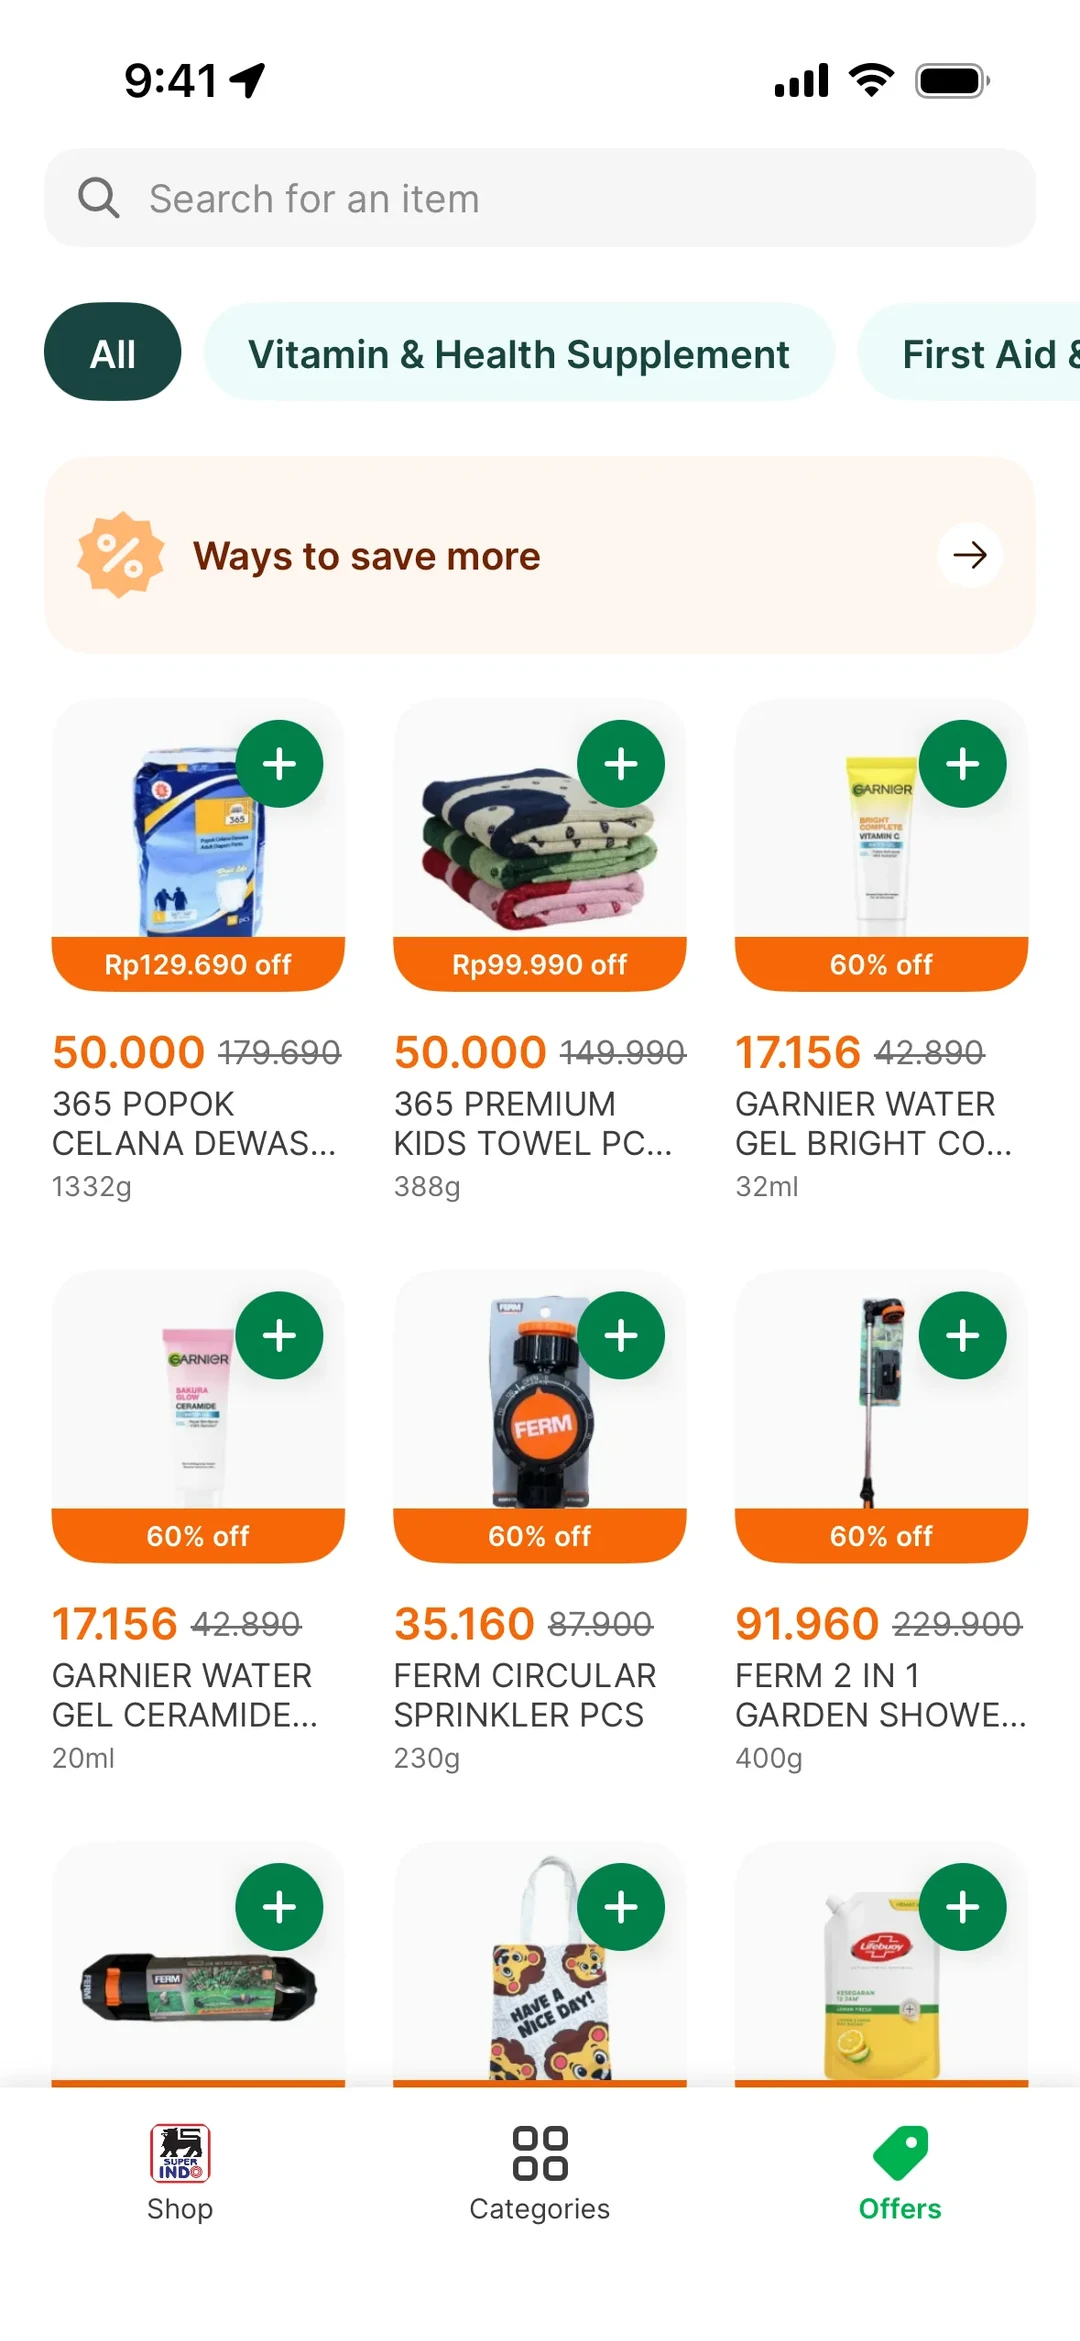
- 1
Note 1: Every product card carries the same orange discount strip, such as “60% off”. When all of them have one, no single deal looks different.
- 2
Note 2: Each card also has the same round green “+” button. With nine of them in view, none of them looks more important than the others.
10. Tesler's Law
Tesler's Law, also called the law of conservation of complexity, says every app has some complexity that can't be removed, only moved. Around 1984, the computer scientist Larry Tesler, who worked at Xerox PARC and Apple, put it this way: “Every application has an inherent amount of irreducible complexity.” (opens in a new tab) The open question is who handles it: the person using the app, the team building it, or the platform underneath.
Buy something with Amazon's 1-Click (opens in a new tab) and you don't type a shipping address or card number, because the system uses the ones you stored. The US Patent and Trademark Office issued Amazon a patent for the technique in September 1999.
1-Click answers that question in the shopper's favor. The work of typing an address and a card number doesn't vanish when it leaves the form. It moves to Amazon's system, which holds the details for you. Moving complexity isn't free, because the team that takes it on has to build and maintain it.
See it in real products
Address and card already filled in
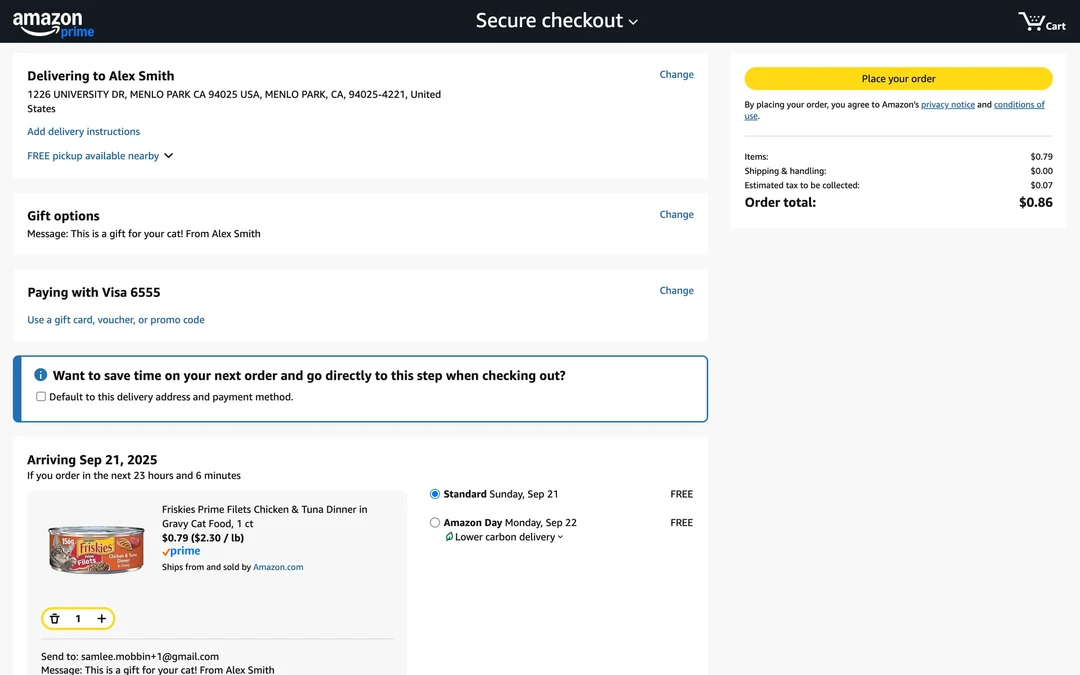
- 1
Note 1: The delivery address is already here, so you didn't type it for this order. Amazon's system holds it for you.
- 2
Note 2: “Paying with Visa 6555” is a stored card. You only type card details again if you press “Change”.
- 3
Note 3: This blue box offers to skip straight to this step next time. Ticking it hands even more of the checkout to Amazon's system.
- 4
Note 4: The one thing left for you to do is “Place your order”.
Apple Pay next to a card form
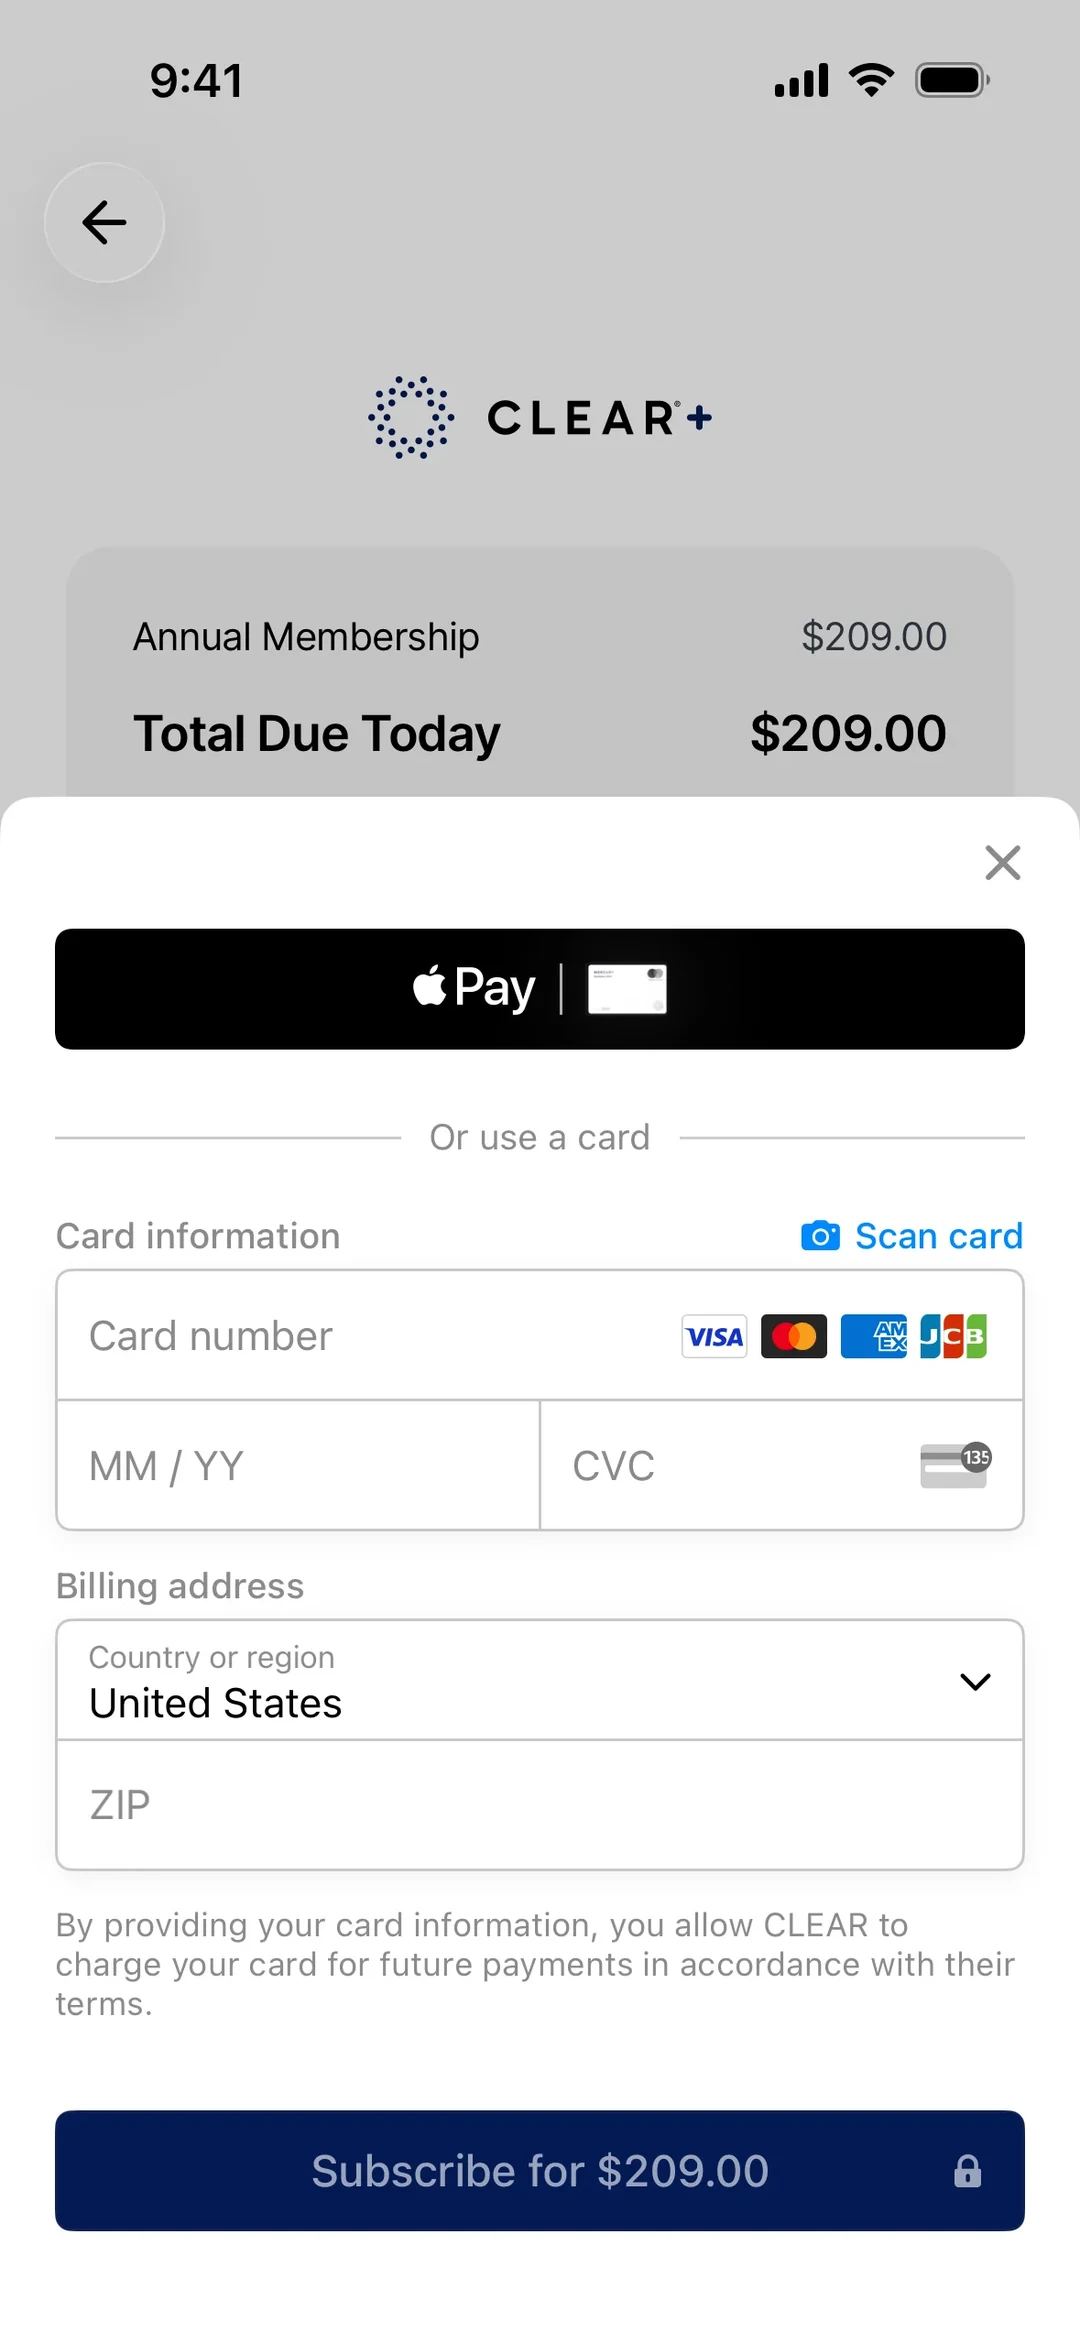
- 1
Note 1: With the Apple Pay button, the phone supplies a card it already holds. You type nothing, because the platform has taken that work on.
- 2
Note 2: “Scan card”, with a camera icon, sits between the two options. It lets you skip typing the card number by hand.
- 3
Note 3: Below “Or use a card”, the work is yours: card number, “MM / YY”, “CVC” and “ZIP”. It's the same payment, but here you do all the typing.
The phone finds the code for you
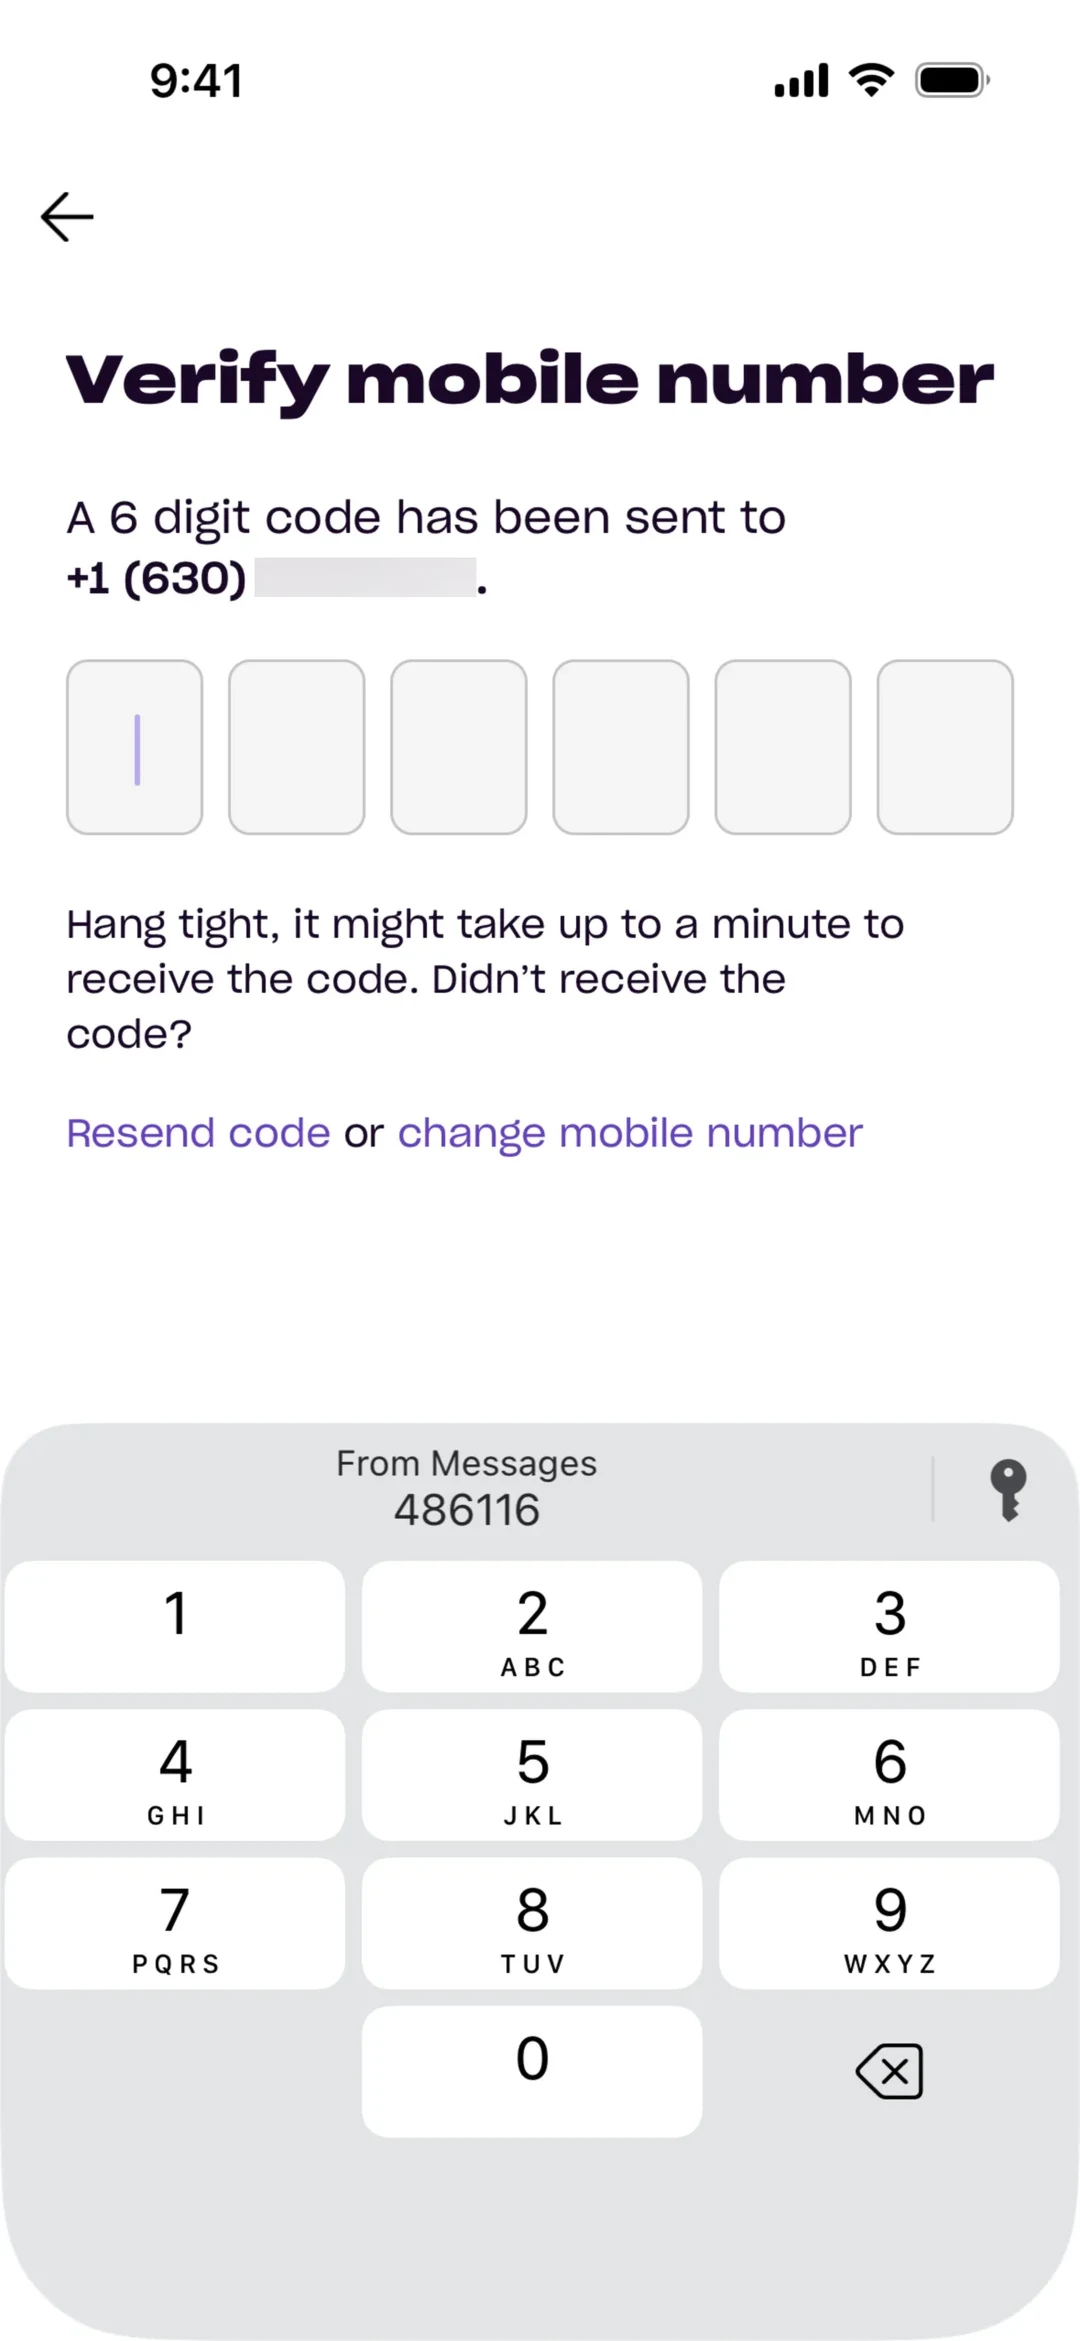
- 1
Note 1: The screen asks for “A 6 digit code”, and the six boxes are still empty. Without help, you'd open your texts, read the code and type it.
- 2
Note 2: Above the keypad, the phone has already found it: “From Messages”, “486116”. The job of finding and copying the code has moved from you to the platform.
Using these laws
Use them in two ways. One is to explain a decision to a team with a reason people can check instead of a matter of taste. The other is to spot a likely problem early, in a design review, before it costs a round of testing.
They don't replace watching real people use your product. Each law was measured in a particular setting, and yours may differ. The laws tell you where to look. A test with a handful of users tells you whether it matters in your product, and when a law and your test disagree, trust the test and work out why.
Sources
Show all 22 sourcesHide sources
Nielsen Norman Group: The End of Web Design (July 2000)
Jakob Nielsen: Jakob's Law of the Internet User Experience
Nielsen Norman Group: Centered Logos Hurt Website Navigation
Nielsen Norman Group: Fitts's Law and Its Applications in UX
Fitts (1954): The information capacity of the human motor system in controlling the amplitude of movement
I. Scott MacKenzie: Fitts' Law (chapter)
Wikipedia: Hick's law
Hick (1952): On the Rate of Gain of Information
Miller (1956): The Magical Number Seven, Plus or Minus Two
Cowan (2001): The magical number 4 in short-term memory
Doherty and Thadhani: IBM report on the economic value of rapid response time (scanned copy)
Kent Beck: The Precious Eyeblink
Nielsen Norman Group: The Aesthetic-Usability Effect
Wertheimer (1923): Laws of Organization in Perceptual Forms
Nielsen Norman Group: Proximity Principle in Visual Design
Kahneman, Fredrickson, Schreiber and Redelmeier (1993): When More Pain Is Preferred to Less
Redelmeier, Katz and Kahneman (2003): Memories of colonoscopy, a randomized trial
Nielsen Norman Group: The Peak-End Rule
Zeigarnik and von Restorff: The memory effects and the stories behind them (Memory & Cognition, 2020)
Larry Tesler: The Law of Conservation of Complexity
Wikipedia: Larry Tesler
Wikipedia: 1-Click